
8 Demand Generation Metrics All Marketers Should Know
Demand generation is an inalienable part of attracting the right audience to your business. It’s also a pretty tricky strategy to maintain.
Why?
Since generating demand relies heavily on educating the prospects, you will have to spend a hefty budget on different tactics that create various learning opportunities for your leads. And you won’t know which of them work and which don’t without employing some KPIs.
That’s why we decided to dedicate today’s article to the essential demand generation metrics to help you navigate and optimize your efforts more efficiently.
What is Demand Generation?
Demand generation is a set of marketing approaches to educate about and build awareness around your brand and product.
So, essentially, you take different digital marketing strategies, be it email marketing, account-based marketing, social media, etc., and use them to generate interest and demand.
By the way, the last words of the previous sentence accurately describe the difference between demand gen and lead gen. The latter primarily focuses on collecting information about potential buyers and turning them into leads.
There are also some peculiarities to the demand generation funnel that set it apart from lead gen. Take a look at this graph:
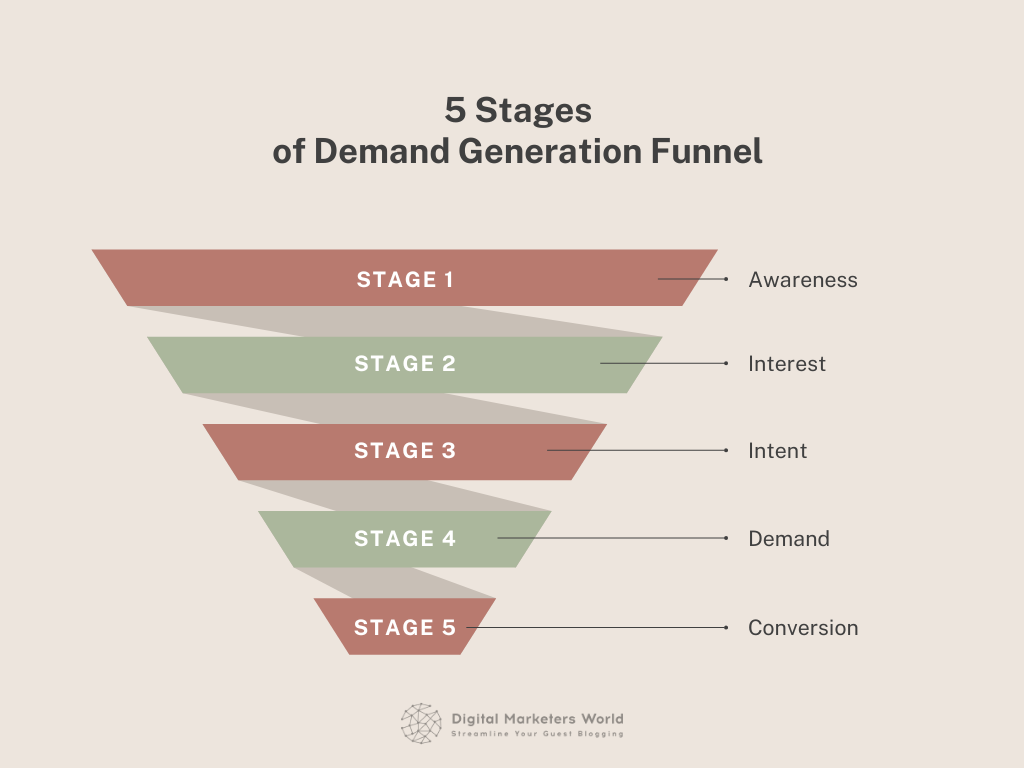
Let’s break it down.
- Awareness. At this TOFU (top-of-the-funnel) stage, you introduce a potential customer to your product or service. It can happen when they visit your website or see an ad on social media.
- Interest. At this point, the prospect expresses interest in learning more about you by subscribing to your newsletter or filling out a signup form.
- Intent. This is the MOFU (middle-of-the-funnel) stage, where your task is to recognize the new prospect’s needs and cater to them. If all goes well, you will have a new marketing-qualified lead.
- Demand. Here, you hand the MQL over to the sales team, and your colleagues evaluate the lead to see if they indeed have the need for your product. Also, the sales team suggests strategies to convert this prospect into a customer (a free trial, a custom plan, etc.).
- Conversion. If the joint marketing and sales teams’ efforts are successful, a conversion happens at the bottom of the funnel (BOFU stage). In other words, the prospect is ready to buy, and once they do, your further efforts will focus on customer retention.
So, if you compare the lead gen and demand gen funnels, you will see that the latter focuses more on recognizing the intent and demand to make sure that the lead is worth your attention.
However, we also want to add another difference – lead generation is about the quantity of prospects, and demand gen is about the quality. And quality over quantity is precisely what many companies prioritized last year in their efforts to generate potential customers, according to the 2021 Demand Gen report.
By the way, there are some other interesting findings you can spot in this research.
For instance, the survey shows that some respondents (43%) see strong coordination between sales and marketing teams as a crucial prerequisite for a successful demand generation strategy:
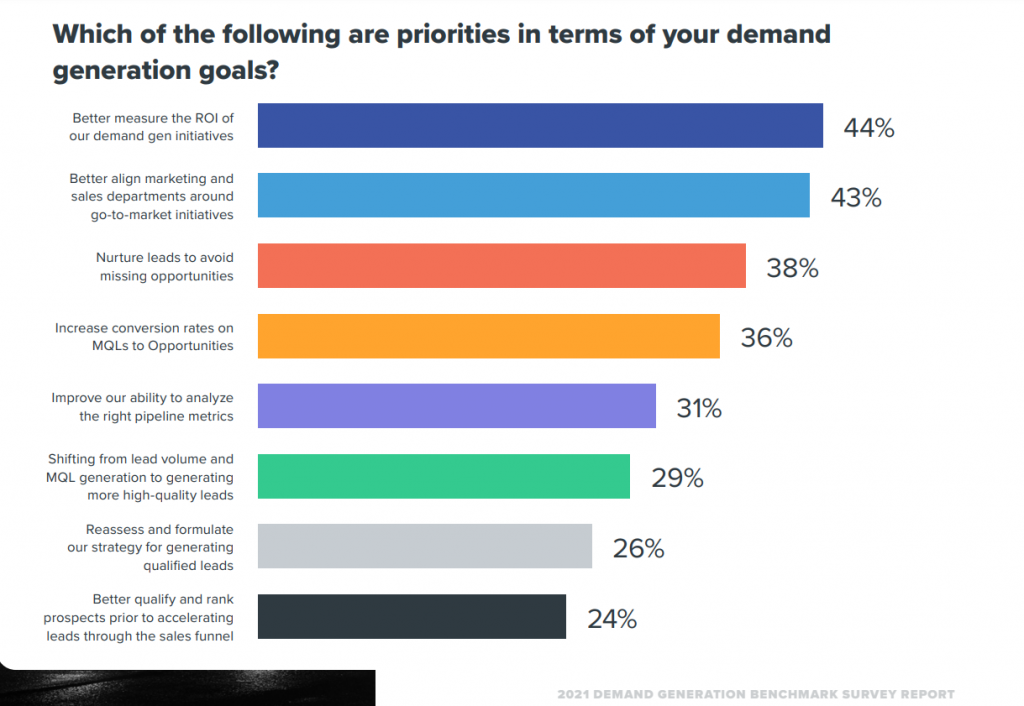
Notice that most respondents (44%) also want to focus on measuring the return on investment of demand gen more effectively. That’s exactly what we’re going to help you with today as we discuss the eight most crucial demand generation metrics.
P.S. If you want to learn more about launching a B2B demand generation program, make sure to check out our detailed guide.
Why is it Important to Track the Right Demand Generation Metrics?
Demand generation metrics are KPIs that help you analyze the direction where your strategy is moving. Without them, you can’t evaluate whether your marketing efforts bring tangible results or not.
This was the main motivation to keep an eye on these metrics. However, let’s look at more specific reasons why you should be crunching the numbers consistently.
First of all, the ROI. As we mentioned in the previous section, almost half of the survey participants said they wanted to better measure their investment in demand generation.
Let’s understand why.
You know that demand gen can involve a multitude of strategies, such as email marketing, influencer marketing, social media, video marketing, etc. Each of them is a considerable investment on its own and not a small one in most cases.
For instance, hiring an agency to develop your social media strategy can cost most than $2,350 a month, and that’s only if you decide to do 60 posts to Feed and 8 boosted posts a month. E-commerce companies need to do more than that, resulting in even higher prices.
Next, if you check out the graph from the demand generation report we shared, you’ll see that some respondents want to nurture leads more effectively and increase the conversion rates of MQLs to opportunities.
All these goals require you to track the conversion rate, marketing cycle length, and other KPIs to understand how long it takes a prospect to act and purchase your product.
Finally, monitoring the right metrics helps you adjust your strategy on the go. It’s natural to encounter some bumps in the road, but it’s the KPIs that help you see how to overcome them.
With the reasons for tracking the KPIs clear, let’s move on to our list of key metrics and explain their roles.
Metric #1: Marketing Qualified Leads (MQLs)
A marketing-qualified lead is a potential buyer that has satisfied the requirements set forth by the marketing team and can now be passed to the sales team for further nurturing.
We have an entire guide on MQLs, which you can check out if you want to learn more about them. For now, let’s focus on the role these leads play in demand generation.
How do you determine someone is a marketing-qualified lead?
Here are some examples of MQL touchpoints:
- Signing up for a free trial
- Downloading trial software
- Engaging with product or service demos
- Filling out a signup form
- Visiting a website repeatedly
- Clicking on banner or social media ads
- Interacting with you or other followers on your social media pages
- Adding products to the wishlist
All these behaviors, along with other engagement metrics, will go into the lead scoring system your sales and marketing teams will use to give each lead a number of points, thus figuring out their probability of becoming a paying customer.
Other factors that go into a lead scoring system include:
- Demographics
- Previous purchase behaviors
- Lead trends (actions that signify a possible conversion)
Tracking the number of people qualified by your marketing team helps you understand where the prospect finds themselves in the demand generation funnel. As a result, it gives you better insight into what it might take to move them to the next stage.
What if you have a low number of MQLs?
It is the indicator that your overall approach to demand generation lacks perspective on what your target audience needs. This means you need to rethink how your strategy functions on each sales funnel stage and make fixes to personalize your target buyer’s experience.
Metric #2: Sales Qualified Leads (SQLs)
A sales-qualified lead is a prospective customer who was researched and vetted by your sales team as the one ready to make a purchase and convert into a client.
What makes an SQL different from an MQL?
Here are some factors to consider:
- Lead scoring points. Every company has its own approach to this process, but usually, an SQL matches more criteria within the scoring system than a marketing-qualified lead.
- Behavior. A sales-qualified exhibits behaviors that your sales team considers to be conversion-ready. For instance, they can schedule and attend a demo call, respond to an email with an offer, etc. Such actions give them higher point values.
- Likelihood of a purchase. A sales-qualified lead matches the criteria of the BANT system: they have the budget, are in authority to make a purchase, show a clear need for your product, and are likely to make a transaction within a specific time.
How can you identify a sales-accepted lead?
Apart from the examples we mentioned in the second bullet point, an SQL can complete the following actions within your attribution model:
- Contact a salesperson from your team
- Sign up for a product or service trial
- Continuously visit the pricing page
- Have items in the cart
- Proceed to the checkout process without completing it
- Interact with your chatbot
Keeping an eye on your SQL has the same importance as tracking the MQLs – it helps you understand whether your marketing funnel works.
Besides, if marketing-qualified leads show no interest in converting, it might indicate a problem with your lead scoring system. Here, it’s crucial to work in coordination with the sales team to fix this issue.
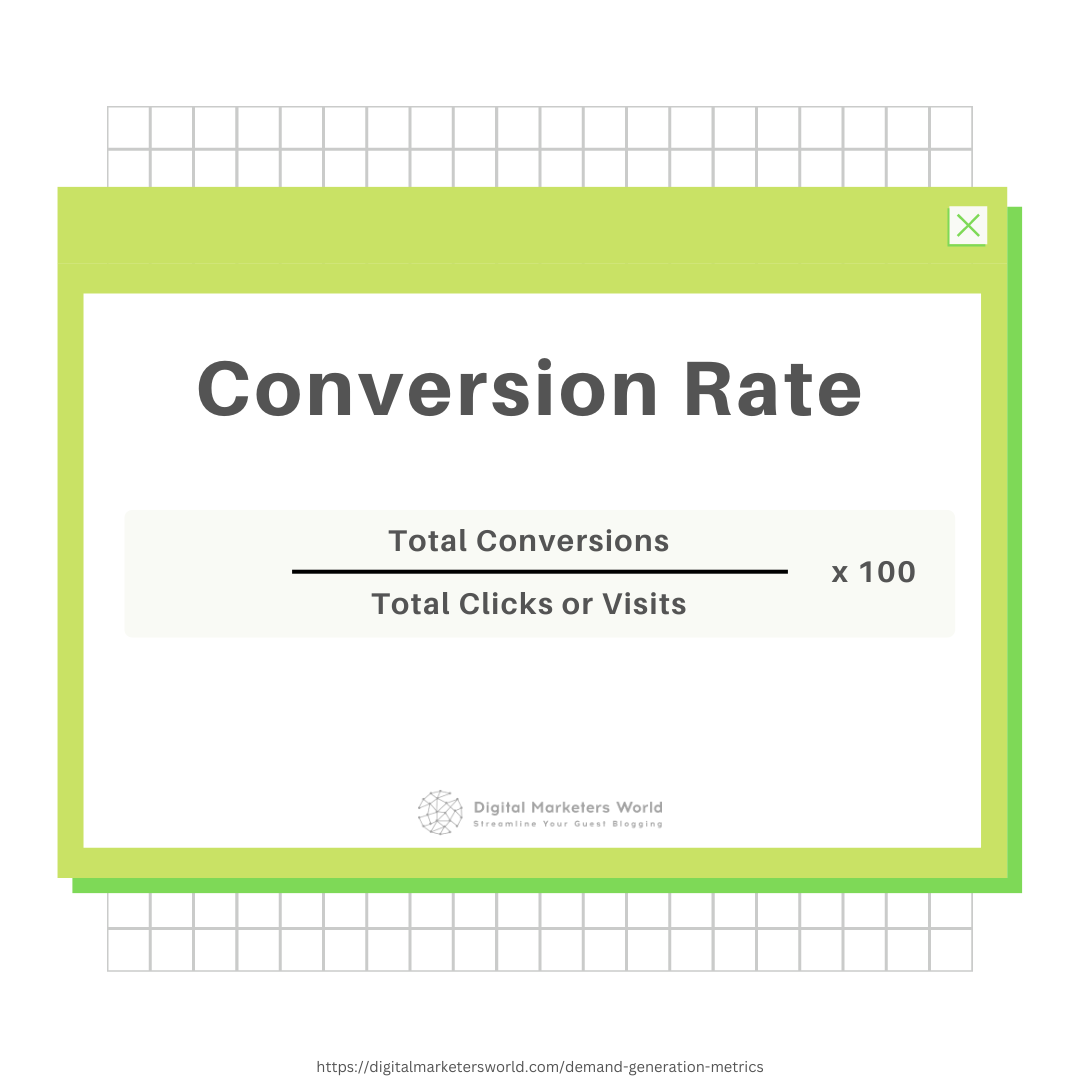
Metric #3: Conversion Rate
A conversion rate in demand generation is the percentage of contacts in your lead list that successfully go from one funnel stage to another. It’s also known as the rate of activations and signups or close rate.
You can calculate this metric by dividing your conversions by total clicks and multiplying the result by 100, just like in the graph below:
You’ve probably encountered this KPI if you read our articles on email marketing and social media marketing metrics.
Now, what counts as a conversion?
It can be any action that brings a prospect to the next sales funnel stage. Here are some examples to give you an idea:
- An email signup
- A filled-out contact form
- A visit to a landing page via a click on your social media
- A booked demo meeting
- A click on an ad
So, for instance, a prospect fills out your contact form. This action means they’ve expressed an interest, thus moving them from the Awareness to the Interest stage. Next, your task will be to study the intent to understand their needs.
Now, there can be many reasons why your win rate is low. Here are some of them:
- Poor lead qualification process. Not every prospect will be ready to buy, so you need to set forth (in conjunction with the sales department) what would define a lead that’s ready to convert.
- Your demand generation efforts are too broad. Sometimes businesses focus too much on creating a funnel that helps them attract as many prospects as possible instead of focusing on the target audience. As a result, most leads they’ve generated aren’t interested in converting because their needs don’t fully align with your offer.
- Your conversion efforts are too pushy. The goal of demand generation is to educate, but if you neglect this part and push a sale onto a prospect too soon, conversion is unlikely.
A solution?
Always focus your demand generation efforts on your target audience only.
Metric #4: Cost Per Acquisition
Cost per acquisition (CPA) reflects how much a business spends on acquiring a new paying customer. You can measure this metric on the campaign or channel level.
Here’s the formula to calculate it:
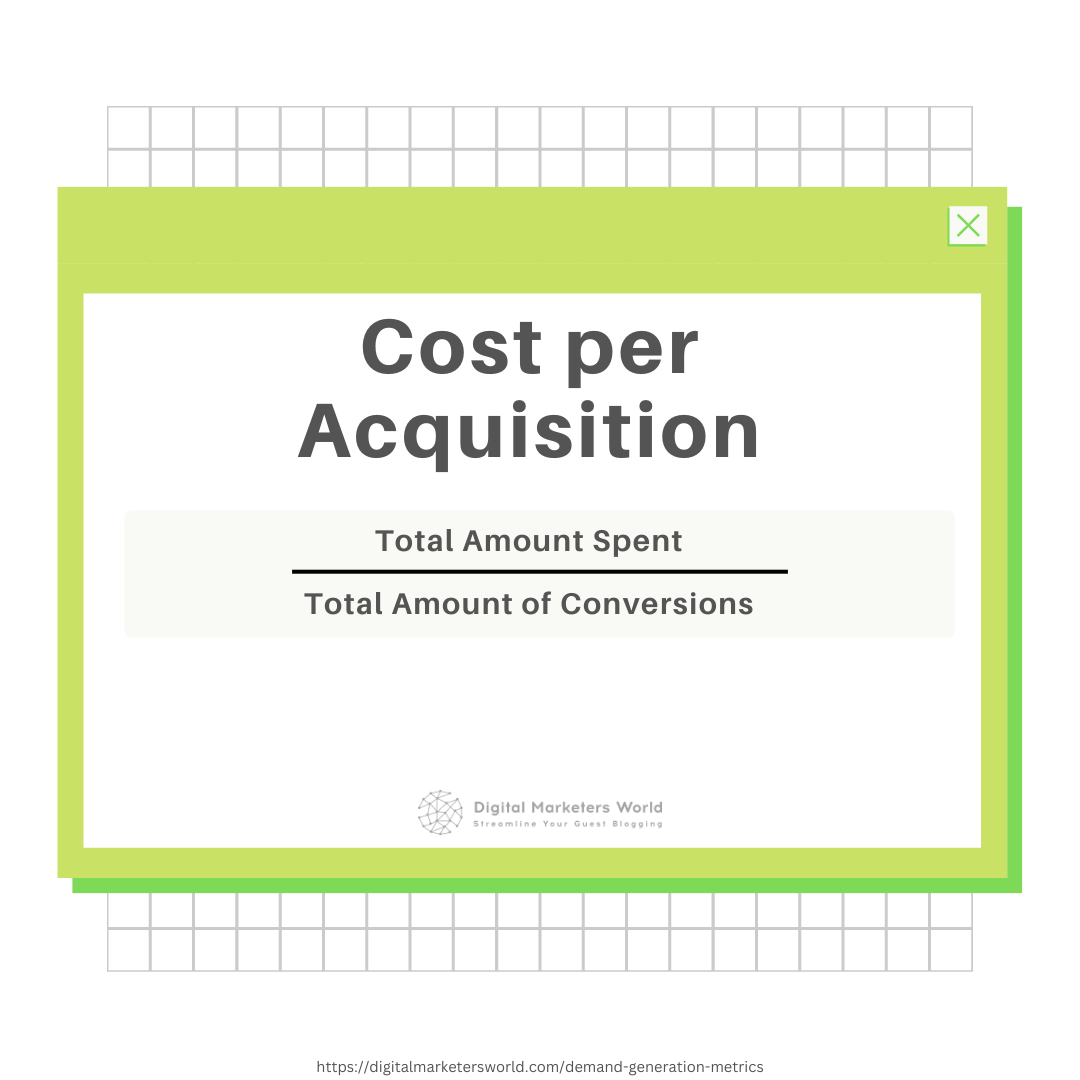
Also, to make sure your CPA measurements are correct, you need to take into account the following:
- Sales costs – all expenses that go on sustaining your sales team.
- Marketing human resources expenses – costs associated with running your marketing team.
- Marketing acquisition costs – can include content marketing, online advertising, etc.
You can compare your customer acquisition cost against your industry benchmarks. For example, the average organic CAC for the B2B SaaS business is $205, for ecommerce – $87, and for IT – $325. You can find more information here.
Customer acquisition cost higher than the industry average is the reason for concern. Possible fixes can include the following:
- Re-evaluating the target audience you focus on
- Optimizing your content strategy
- A/B testing
- Analyzing and adjusting your lead nurturing strategies
- Switching from outbound to inbound marketing tactics
By the way, this metric is often confused with cost per lead, which we’ll talk about next.
Metric #5: Cost Per Lead (CPL)
Cost per lead (CPL) defines the amount of money spent on generating a new lead. CPL is also a widely used online advertising model.
To calculate the cost per lead, you need to divide your marketing budget by the total number of leads, just like here:
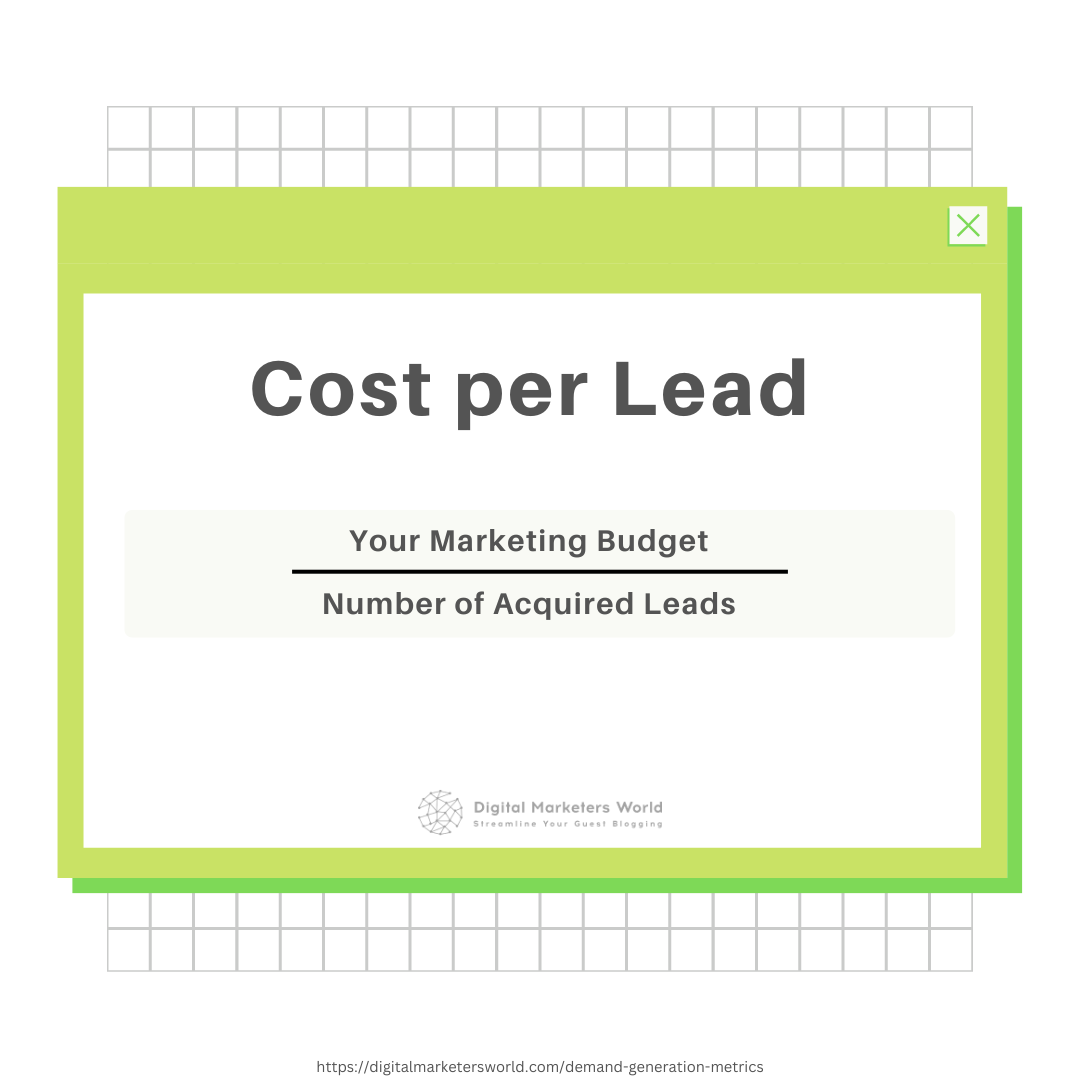
CPL is one of the core key performance indicators helping you evaluate the effectiveness of your demand generation campaign. Essentially, it shows how expensive bringing in a new lead is, and if you spend more on attracting prospects than your existing customers spend on products, you’re not making a profit.
So, what is considered a good cost per lead?
Let’s look at the following example.
Say your customer spends around $2,000 on your products on average from the time they convert to the time they churn. If your gross profit is 50%, you get $1,000.
Next, you need to look at the rate of closing purchase deals. If your sales team converts 3 leads out of 10, your conversion rate is 30%.
So, if we sum everything up, a new lead generates $600 profit for your company.
To see if that’s a good result, you can compare this CPL against your industry averages. For instance, in the technology sector, the average cost per lead is $208, in travel – $106, and in retail – $34. You can see more stats in this research by Marketing Charts.
If your CPL is too high, you can reduce it by employing the following methods:
- Retargeting campaigns
- Tweaking the demographics of your target audience
- Optimizing page loading speed
- Reworking your landing pages
- Identifying and eliminating poorly underperforming demand generation channels
Overlooking your cost per lead can cause miscalculations in ROI and leaks in your demand generation budget.
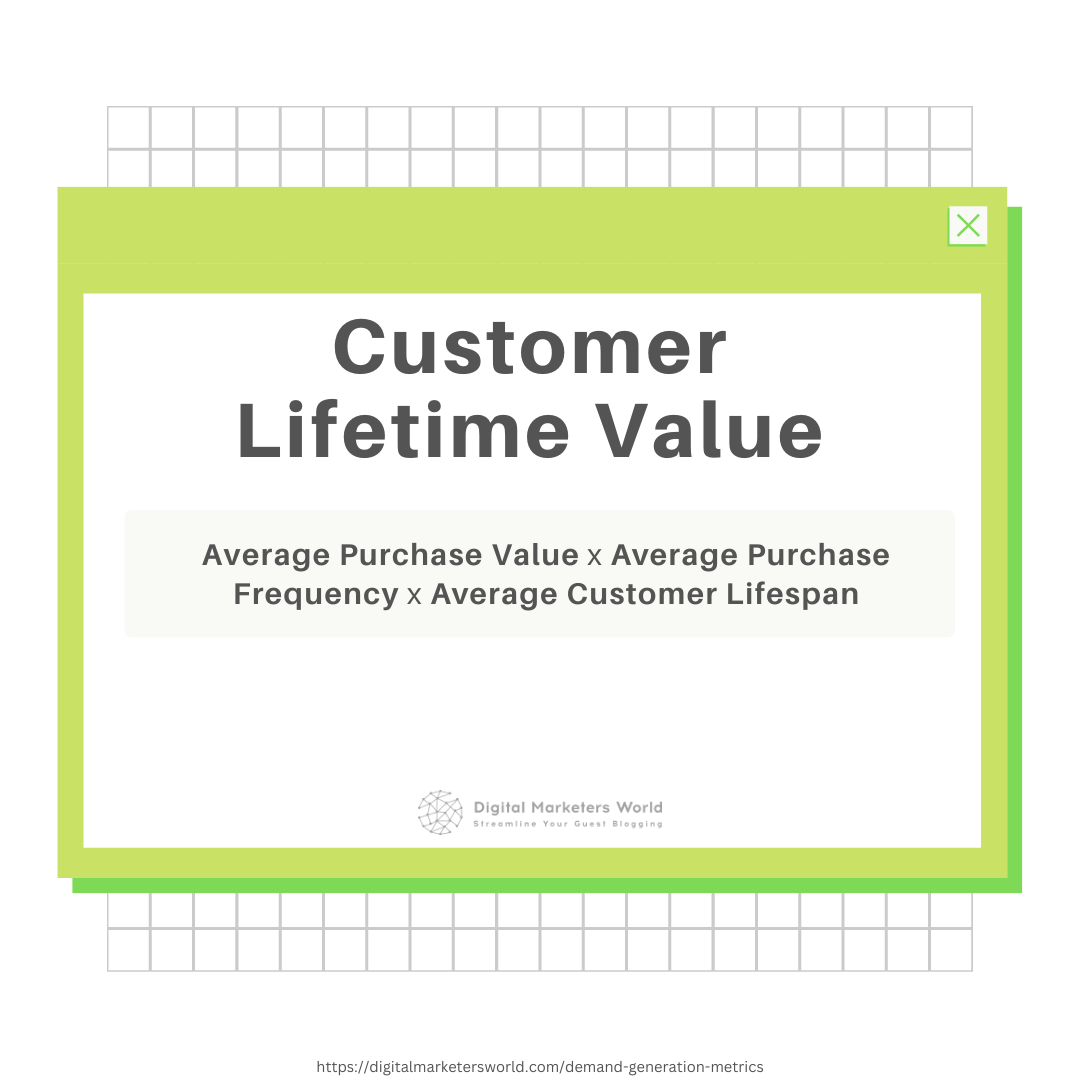
Metric #6: Customer Lifetime Value
Customer Lifetime Value (CLV) shows how valuable a customer was to your business during the entire time they actively purchased your products.
Let’s rephrase to make it more digestible: you need to calculate this metric to understand how much you will earn from each new buyer generated in a single marketing campaign.
Here’s the formula for it:
Apart from informing you about how much you earn from a single customer, this metric can also help:
- Reduce customer attrition
- Boost repeat sales
- Drive more higher-value sales
- Improve your business’s profitability
However, with these lucrative benefits also come some significant challenges, the biggest being the measurement of this metric.
To make tracking this KPI more efficient, you need to have a customer relationship management (CRM) tool and an enterprise resource planning (ERP) system in place. Next, to make sure your calculations are as precise as possible, you’ll need to do the following:
- Figure out your average order value. You can start looking at the data within a specific timespan, e.g., two-three months.
- Determine the average number of transactions within a specific period. Essentially, you need to check how often your customers come to make a purchase (e.g., once a week or once a year to renew their subscription).
- Analyze customer retention. This data will show how long an average customer stays with your brand.
With all this information at hand, you can go ahead and calculate the CLP. Note, however, that even the slightest change in your business operations and marketing strategy can trigger changes in this KPI.
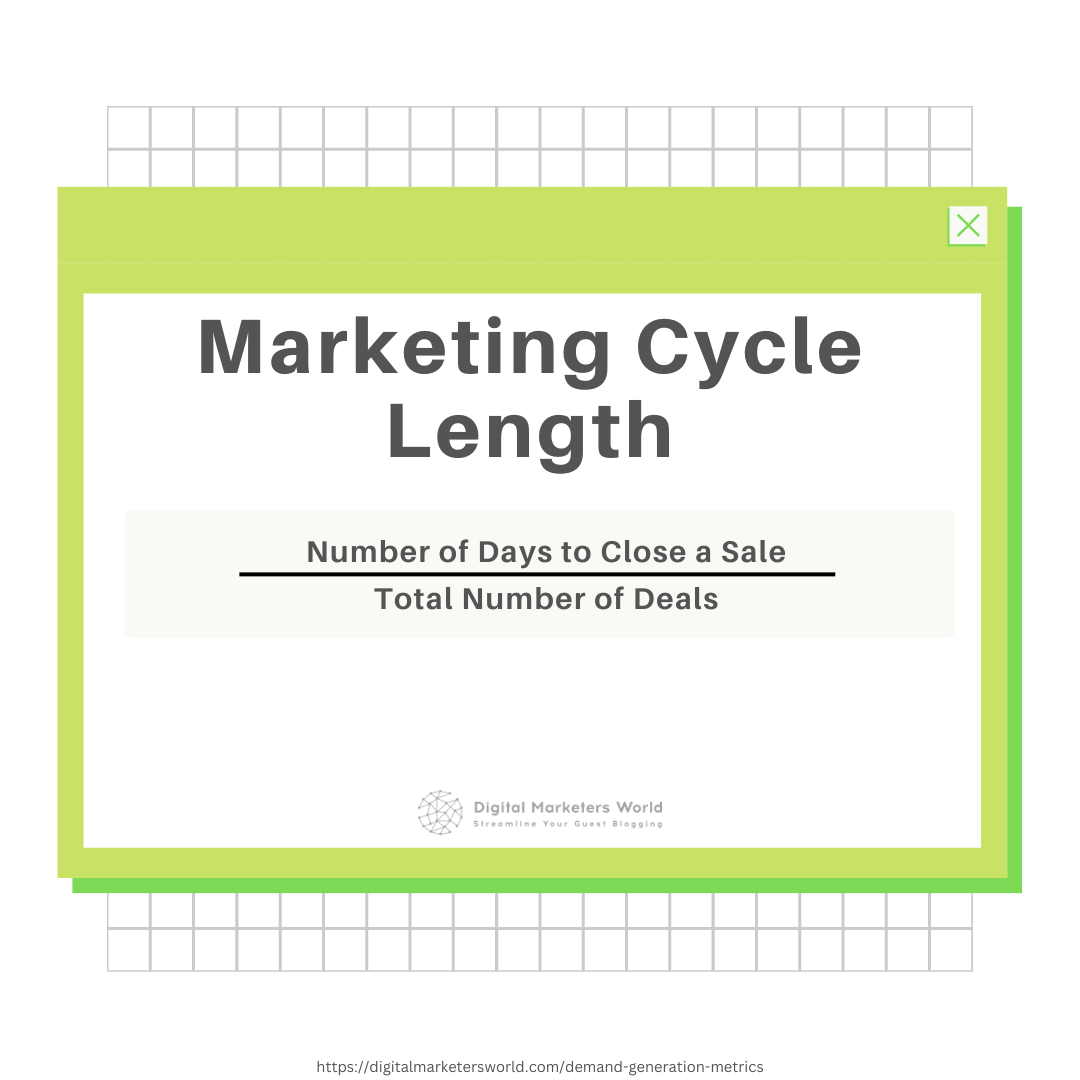
Metric #7: Marketing Cycle Length
Marketing cycle length is a demand generation KPI helping you determine how long it takes to acquire a new customer.
Here’s a formula to calculate this metric:
Now, you might think that a shorter marketing cycle length is probably what you should be aiming for, but it’s not entirely so.
As you know, a sales cycle consists of four stages – Awareness, Intent, Desire, and Action (a.k.a. AIDA). Ideally, your prospect should go through each stage uninterrupted and end the customer journey by purchasing your product.
Now, in ecommerce, this cycle will be considerably shorter. However, things might not go as quickly if you’re in B2B.
In fact, according to Marketing Charts, three-quarters of B2B marketers (74.6%) said it took their customers at least 4 months to complete the cycle, and 46.6% out of that percentage claimed it took more than 7 months.
We can connect such a considerable difference with the fact that a B2B buyer usually needs more time for research and consideration before making the final purchase decision. That’s why B2B demand generation marketing bets more on educating and building a strong connection with a prospect than B2C.
So, what benefits can you draw from tracking this metric?
First and foremost, it helps you estimate your total revenue from a campaign. Apart from that, you get a clearer picture of the effort, resources, and time you spend on winning a new customer.
But what if your marketing cycle length is longer than the average in your industry?
In this case, pay attention to the strategies involved in your sales process. You might find problems with lead qualification and scoring, misused sales channels, or even your free trial period might be too long.
Metric #8: Average Deal Size
Average deal size (a.k.a. average contract value) shows how much a customer spends on one transaction.
Below you can see the formula for ADS:
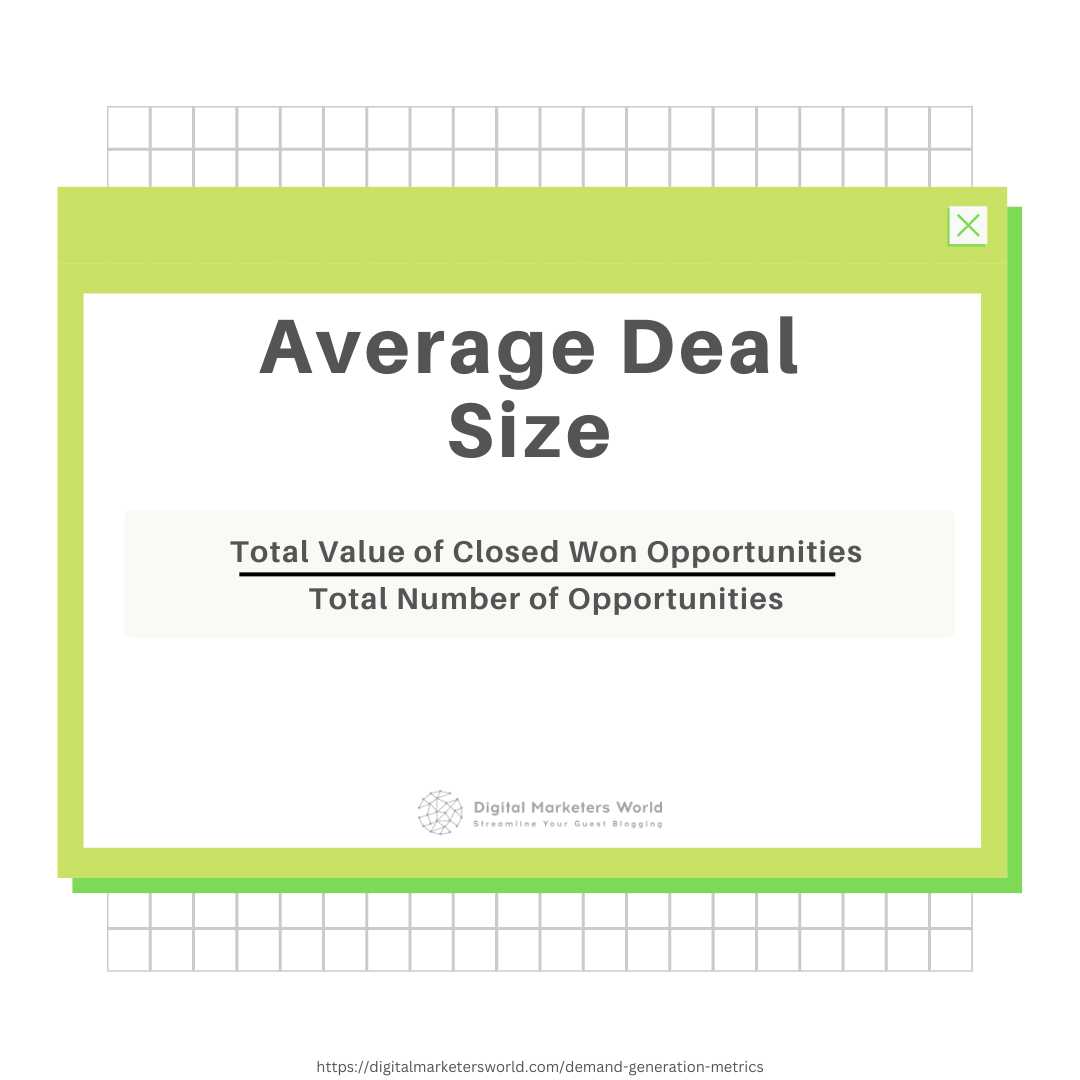
Regarding demand generation, the average deal size helps you understand which of your marketing channels bring you the most deals, thus showing you what pays off and what doesn’t.
Apart from that, you can use this important metric to discover valuable insights to optimize your:
- Sales pipeline
- Sales process
- The performance of your sales executives
Here’s a more concrete example of how this KPI can help.
Let’s say you’ve noticed that your average deal size has increased, but your monthly recurring revenue hasn’t seen any changes. It could happen because your sales team focuses on smaller sales opportunities, or your one-time customers don’t see enough value in becoming your regular clients.
Also, interestingly enough, a sudden change in this metric can indicate that your sales funnel is changing and that you’re attracting a different audience. Thus, it’s a clear opportunity to grow your reach but also adjust your current demand generation and lead nurturing efforts.
Now Over to You
Like all other digital marketing strategies, demand generation is only effective when properly measured.
Of course, your set of performance metrics for generating demand will vary depending on your industry, the product or service you’re selling, and your overall business goals. However, no matter where your company finds itself, consistently monitoring your efforts is the only way to know you’re moving in the right direction.
Interested in learning more about using demand generation and other strategies for your brand? Follow our blog – we have many more insightful pieces coming!

Mariia is a content strategist and editor at Digital Marketer’s World. She is passionate about educating others on all things marketing and believes in the power of the written word.