13 Social Media KPIs to Effectively Monitor Your Online Presence
It is impossible to eyeball a social media strategy.
The overall look and feel of your presence on social channels might feel right, but it doesn’t mean you’re going in the right direction.
So, if you aim to run a successful SMM strategy, you can’t overlook the importance of KPIs. Besides, there is a metric for just about everything you want to track related to your online activity. So, you can, in fact, measure your social media performance from top to bottom.
In today’s guide, we have thirteen important KPIs with detailed explanations of how and when to track them.
What are Social Media KPIs?
Social Media KPIs (key performance indicators) are metrics helping you figure out if your social media marketing strategy brings tangible results.
Essentially, these KPIs show the data that reflects the effectiveness of your social media presence. You can measure them either for each individual social channel or for all your social media accounts collectively. The ability to track very specific metrics is what sets social media and traditional marketing apart.
A good social media KPI should always be straightforward and easy to measure.
What does it mean?
Basically, you want your KPI to prompt a decision, not more questions.
For example, instead of setting a goal of simply getting more new followers, you could focus on increasing your follower count by 30% from what you currently have. This way, you set a clear objective, making it also easier to figure out how to measure it.
To help you make your social media goals more clear and measurable, you can use the trusty-old SMART model (which you can also apply to your business goals):
- Specific – make your KPIs as concrete as possible (instead of generalizing, use specific numbers you want to reach).
- Measurable – you should be able to quantify and evaluate your progress.
- Achievable – the KPI should be realistic, given the resources you have available.
- Relevant – only track metrics that make sense, given your current social media activity and your objectives for the nearest future.
- Time-bound – set a realistic timeframe within which a particular KPI can show sustainable results.
Note, however, that KPIs are a very fluid notion – it’s possible that you’ll have to tweak them as your campaign unfolds. So, occasionally reevaluating them is completely normal.
With all the basic info about SMM key performance indicators clear, let’s move on to the whys of implementing them into your social media marketing strategy.
Why Should You Track Social Media KPIs?
We all know how competitive social media marketing is. In 2021, a whopping 91.9% of companies with over 100 employees were expected to use social media for marketing in the U.S. alone. And while we’re still waiting on the data in 2022, there’s no doubt this percentage has grown.
So, considering the level of rivalry you will face on social media, it’s absolutely vital to continuously monitor the metrics to make sure you stay relevant.
Next stop – the effectiveness of your social strategy.
Keeping an eye on the KPIs is actually the only way to know you’re moving in the right direction.
Let’s take our example of getting more followers. If you don’t track the metrics, how will you know that the follower count has grown by 30%? Or what will tell you that the posts on case studies on your blog brought 40% more social traffic to your website?
Sure, you can make anecdotal guesses, but such an approach is not holistic and won’t deliver any tangible results.
Finally, being fully aware of what’s going on in the metrics town is an effective way to make sure you remain connected with your audience.
Let us explain.
A B2B business, on average, has a bit over 100,000 followers on LinkedIn, 34K followers on Twitter, and 18K on Instagram.
Although this is not the largest follower count per platform a business can have, it’s still a lot to handle.
So, how can you ensure your web content aligns with the interests of your followers?
You could try to survey them all, but it’s hardly possible that each of them will submit feedback.
A more comprehensive approach would be to track metrics like bounce rate, impressions, CTR, likes, shares, and other reactions. This way, you can estimate if people like your content or not and adjust the strategy accordingly.
Hopefully, we’ve convinced you of the importance of tracking KPIs because now it’s time to move on to the list of the social media metrics you absolutely should include in your agenda.
KPI#1: Followers
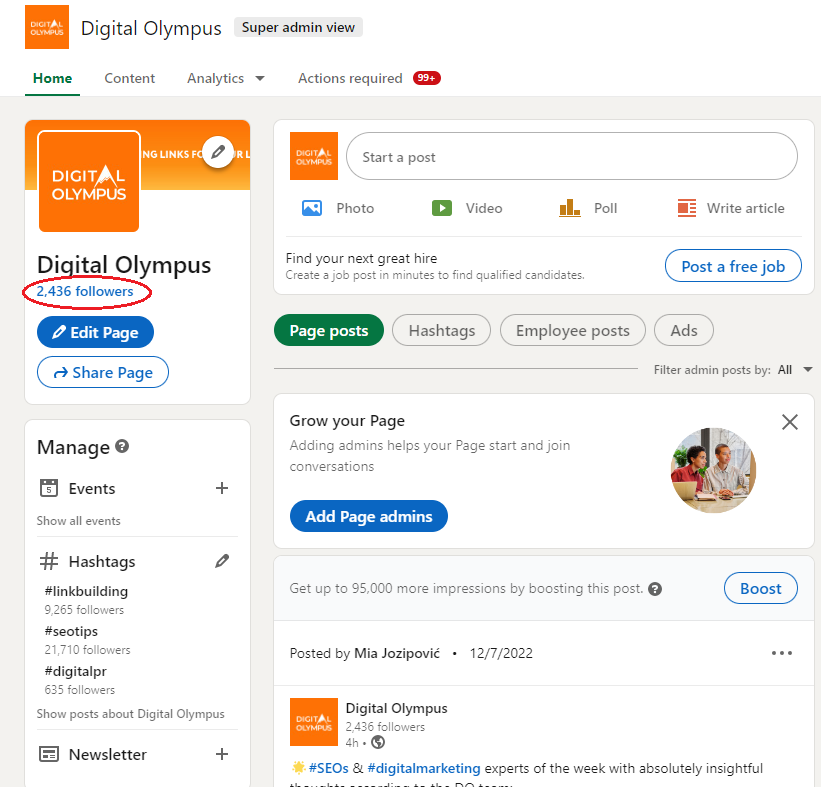
Followers or follower count is the number of subscribers your social media page has at a given time.
It’s really easy to see how many followers your account has by just visiting it. Here’s what it looks like on LinkedIn:
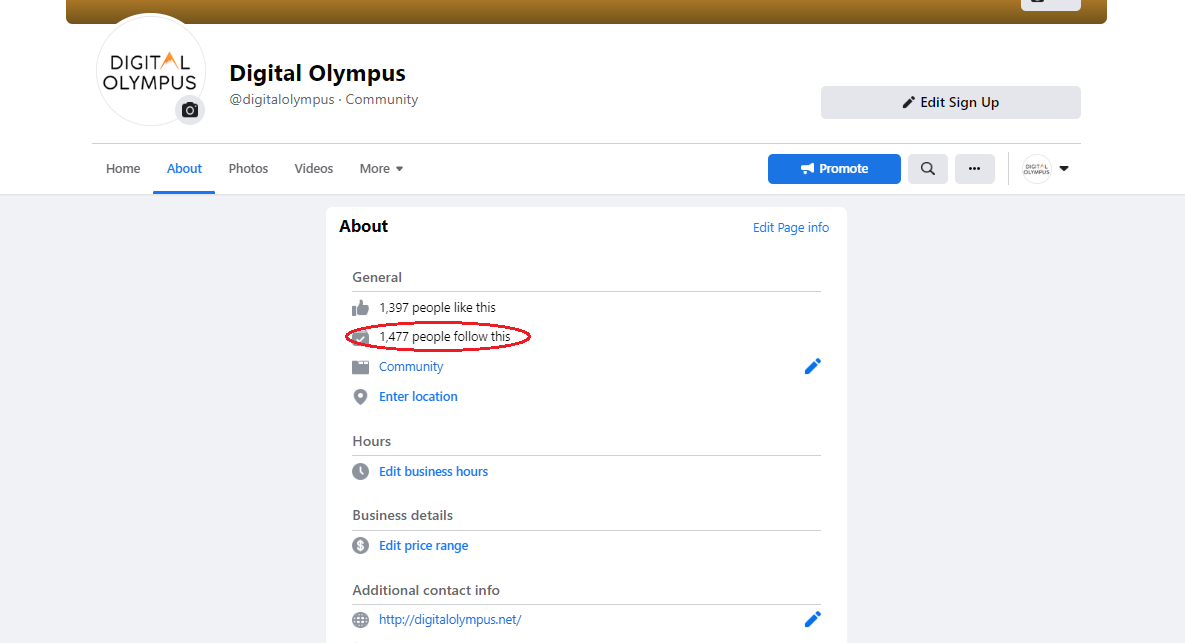
If we talk about Facebook, you’ll need to go to the About page to see how many subscribers you have (you’ll also see the number of users who liked your page):
Now, let’s make it more interesting.
You can also track the follower growth trend on all social media networks. However, built-in analytics tools on every platform will show this trend differently.
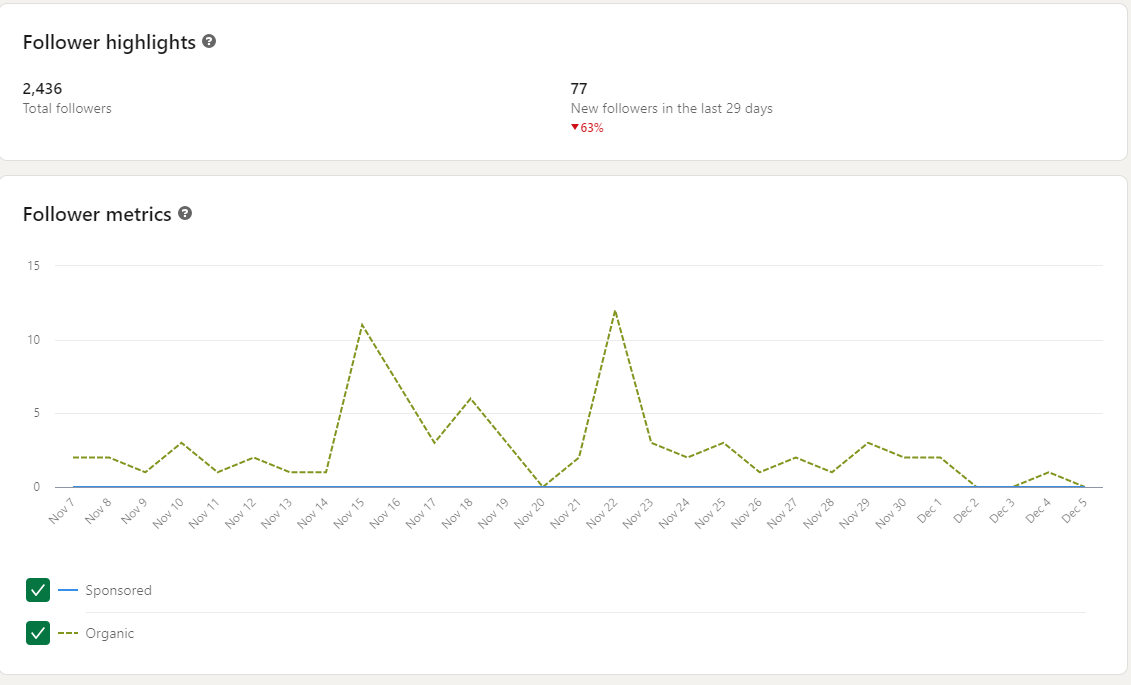
For example, on LinkedIn, you can see the number of followers acquired organically and via paid channels. You can also track the follower acquisition trend within a month (it will show you how many new subscribers you’ve gained compared to the previous month), along with demographics:
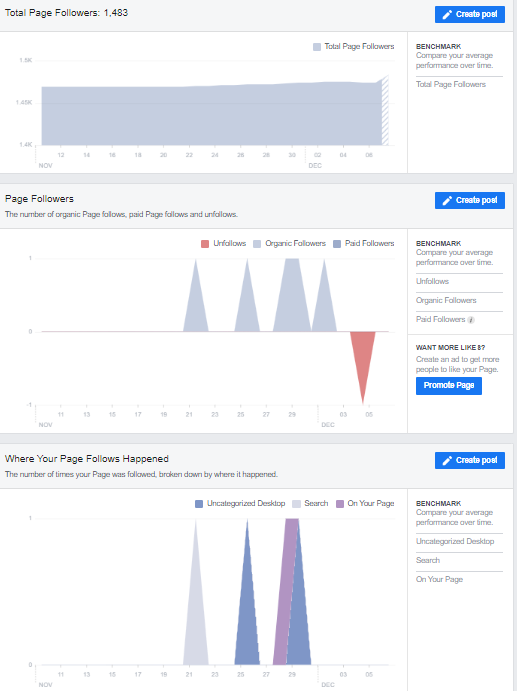
You can also find a similar social media report in Facebook Insights, but it will also show you the unfollows, the medium people used to subscribe to your page, along with the general growth progression:
When should you track follower count?
This vanity metric can show the general interest of the public in your social media presence.
A consistent growth rate of organic followers shows that your content caters to the interests of your target audience.
On the other hand, a good growth trend in sponsored followers reflects the efficiency of your efforts in paid media (e.g., if you’ve launched a social media advertising campaign to attract more subscribers).
KPI #2: Impressions
Impressions show how many times your social post appeared in someone’s timeline. However, it doesn’t mean the person noticed your post.
You can view the number of impressions on every social media platform, usually both the general amount and the amount per post.
Here’s what this metric looks like on LinkedIn:
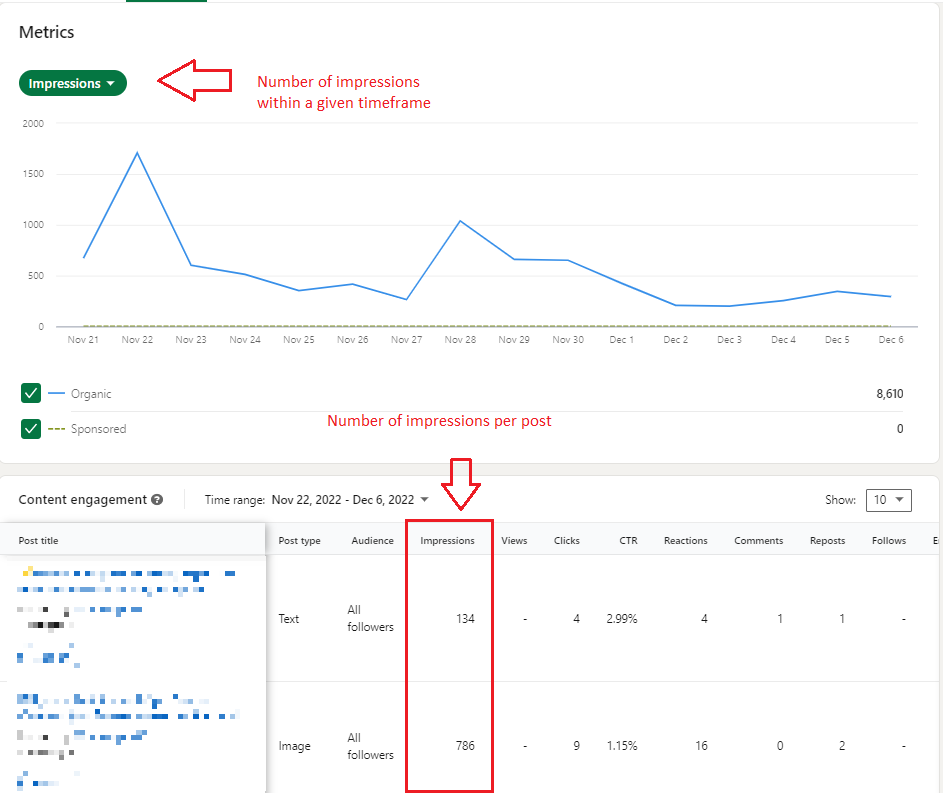
On Facebook, you can view this metric under Reach (and under Posts if you want to know how many impressions each post has received):
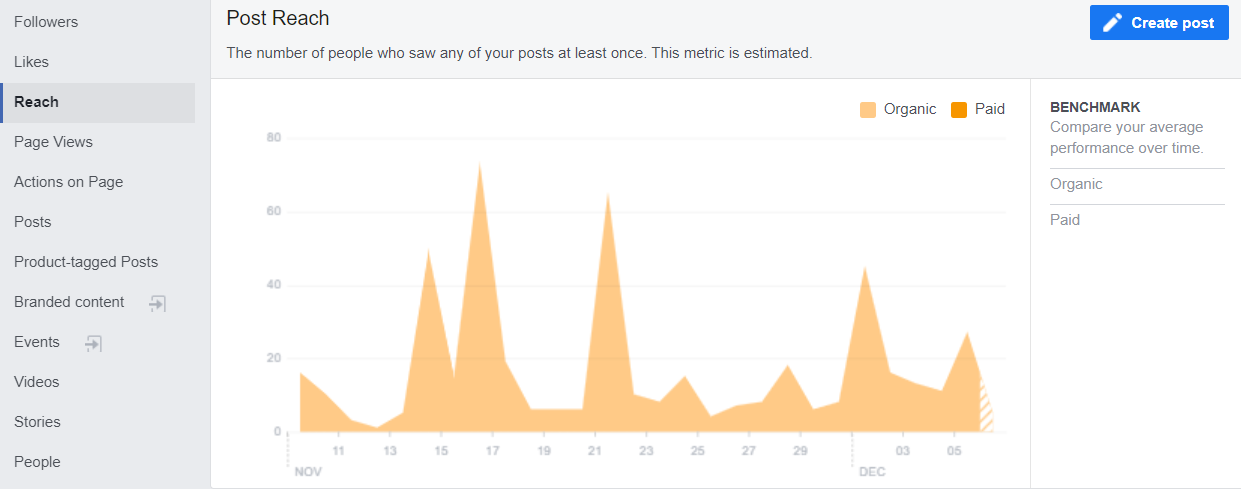
When should you track impressions?
Although it’s a rather vague metric (impressions sum up all times a post appears in the newsfeed, not just for unique viewers), it measures your ability to produce content that appeals to your target audience.
Naturally, if the number of impressions is low, it means your content doesn’t cater to the needs of those you want to reach.
KPI #3: Clicks
Clicks reflect the number of times people have clicked on your social media posts. It’s another metric that measures social media engagement.
All social networks allow you to view the number of clicks per post. In LinkedIn Analytics, you should go to Analytics, Content, and then choose Clicks from the drop-down menu.
You will see something similar to this:
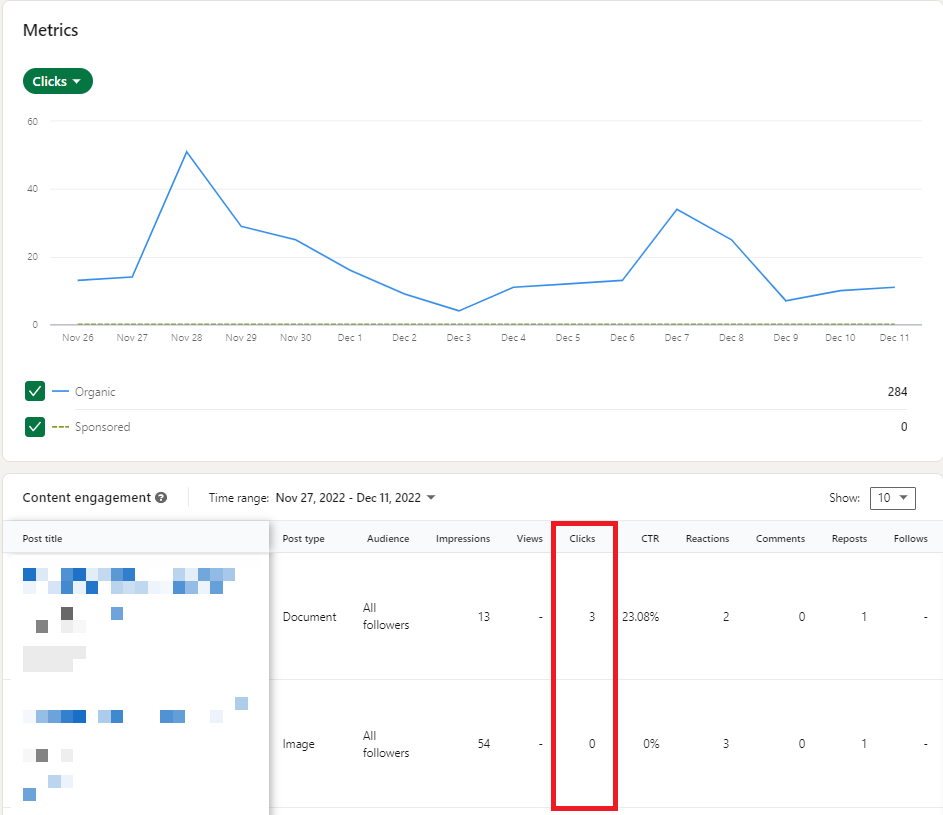
The graph above shows the progression of click growth within a pre-set time frame, while the table below lists engagement metrics for every post, including content clicks.
Facebook also shares the info on the number of clicks in the Insights tab. You can both see the clicks per post and on your page links, i.e., direction, website, action button, and phone number clicks. You can also view who clicked on your page info by age/gender, country, city, and device:
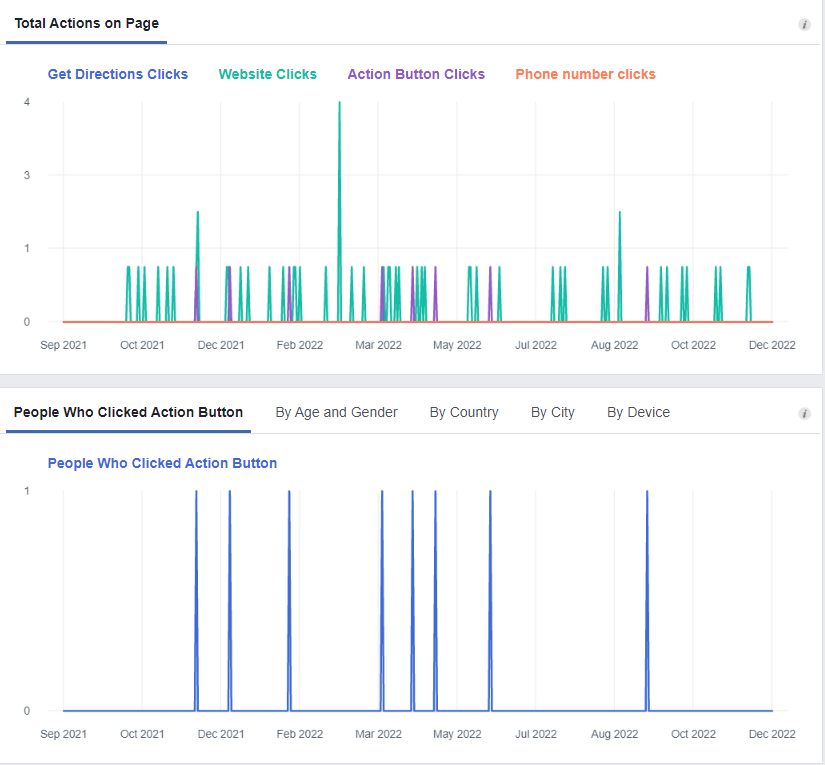
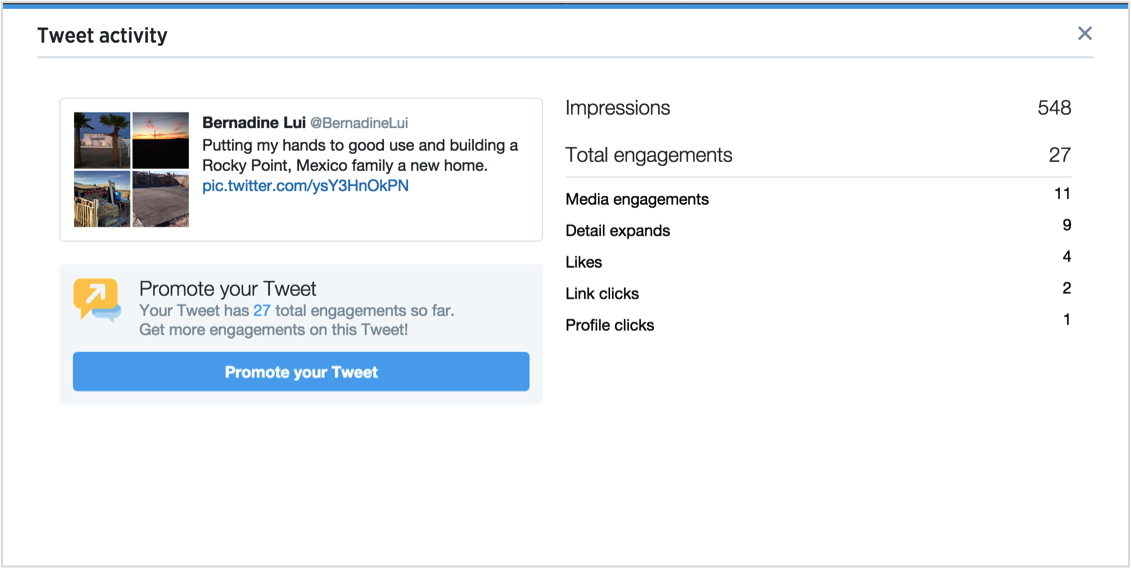
As for Twitter, you can only view the number of link clicks in your tweets along with profile clicks:
If you need more data on post clicks, though, you’ll have to use a different tool. For instance, Semrush has algorithms providing a detailed overview of clicks along with the engagement rate per post:

The same goes for Instagram and Snapchat – their built-in analytics dashboards only provide data on bio clicks.
By the way, Semrush isn’t the only tool allowing you to track this metric. We’ve created a blog post with the 12 best social media management tools (some of them are free) that you can use to track clicks and other KPIs.
When tracking clicks is essential?
Clicks reflect engagement, so whenever you want to measure how much people like your content or not, this metric can come in handy.
Apart from that, you should measure this KPI if you’re promoting something on social media, e.g., a landing page or a product page. The number of clicks can indicate how much of your website traffic is attributed to referrals from social media.
KPI #4: Click-Through Rate
A click-through rate (CTR) in relation to social media shows the percentage of people who’ve seen your post or social media and have clicked on the call-to-action (CTA) button to take a specific action (learn more, download, buy a product, etc.).
You can calculate CTR using this formula:
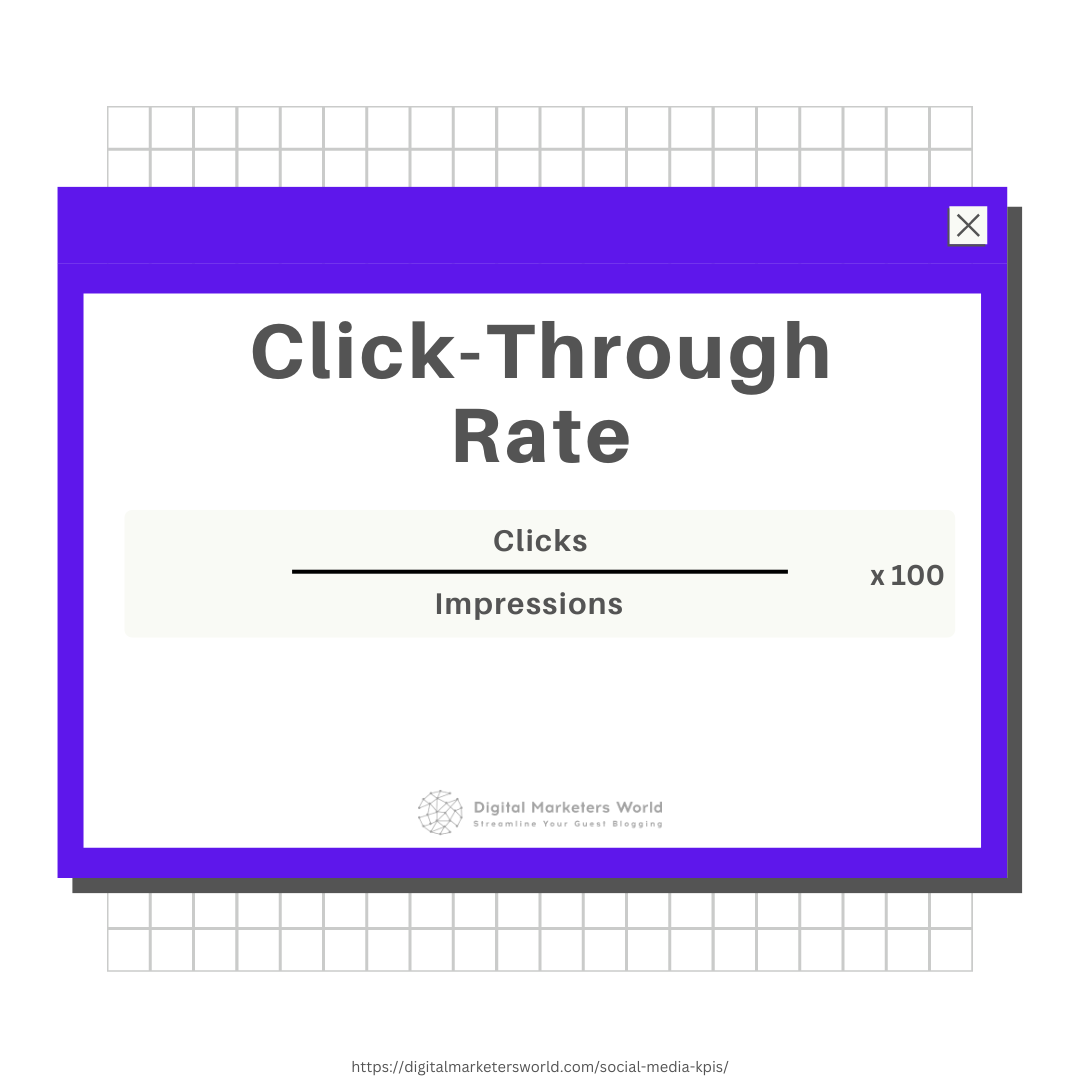
Here’s what this metric looks like on LinkedIn (you can track it along with clicks in the Content section of the Analytics):
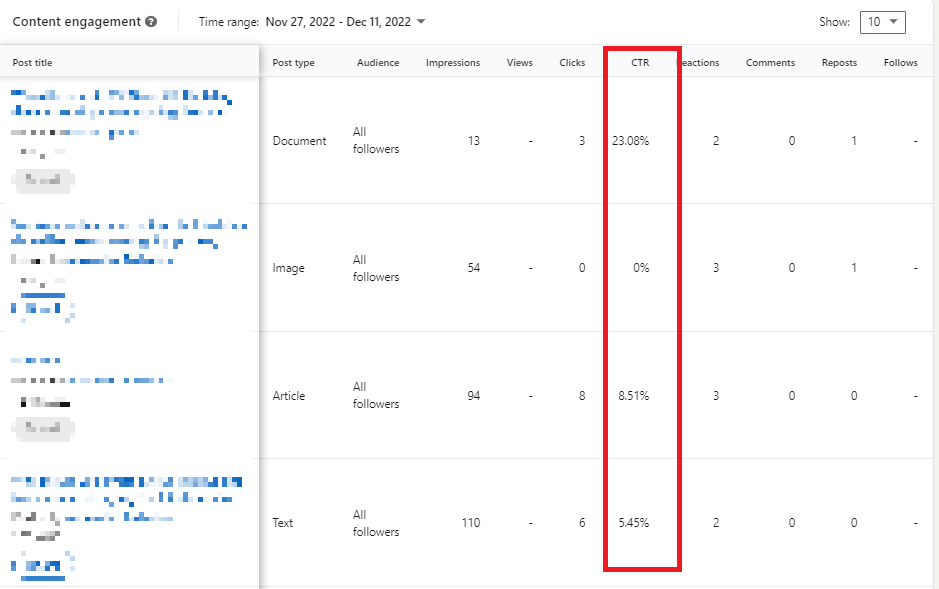
Unfortunately, you can’t view CTR per post on other social media platforms (on Facebook, only for Facebook Ads). So you will need to either use a different tool to track it or simply divide the number of clicks on a given post by the number of people who viewed it and multiply by 100 to get the percentage.
When to track the click-through rate?
CTR is another engagement KPI showing how many people want to learn more about the content published on your account.
Besides, CTR is a good indicator of how well the content in your post promotes what you offer. So, you can apply this metric to measure the engagement of your social media ad campaigns.
KPI #5: Likes (& Reactions)
Likes show how many people responded positively to your content. Reactions are forms of engagement reflecting the possible emotions people feel when viewing your social media posts.
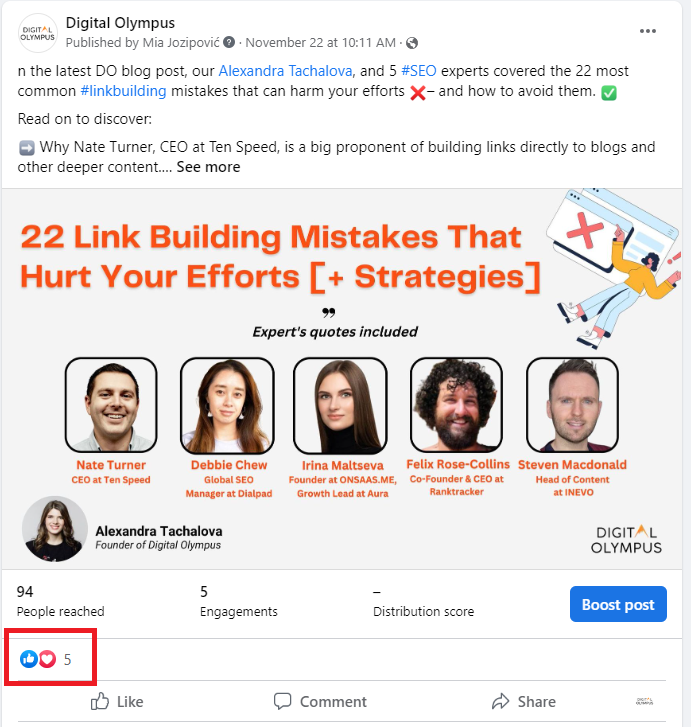
Most social media platforms have merged likes and reactions so that they appear together under each post. Facebook, for instance, counts both likes and reactions as one:
Now, how do you track this metric?
For Facebook, you should either go to Insights and choose between Page Likes (to see the general number of people who likes your business page) or to Posts, where you’ll find all the reactions, comments, and shares counted together per post:

LinkedIn is a bit more specific and shows the growth of reactions over time, plus the number of likes per post:
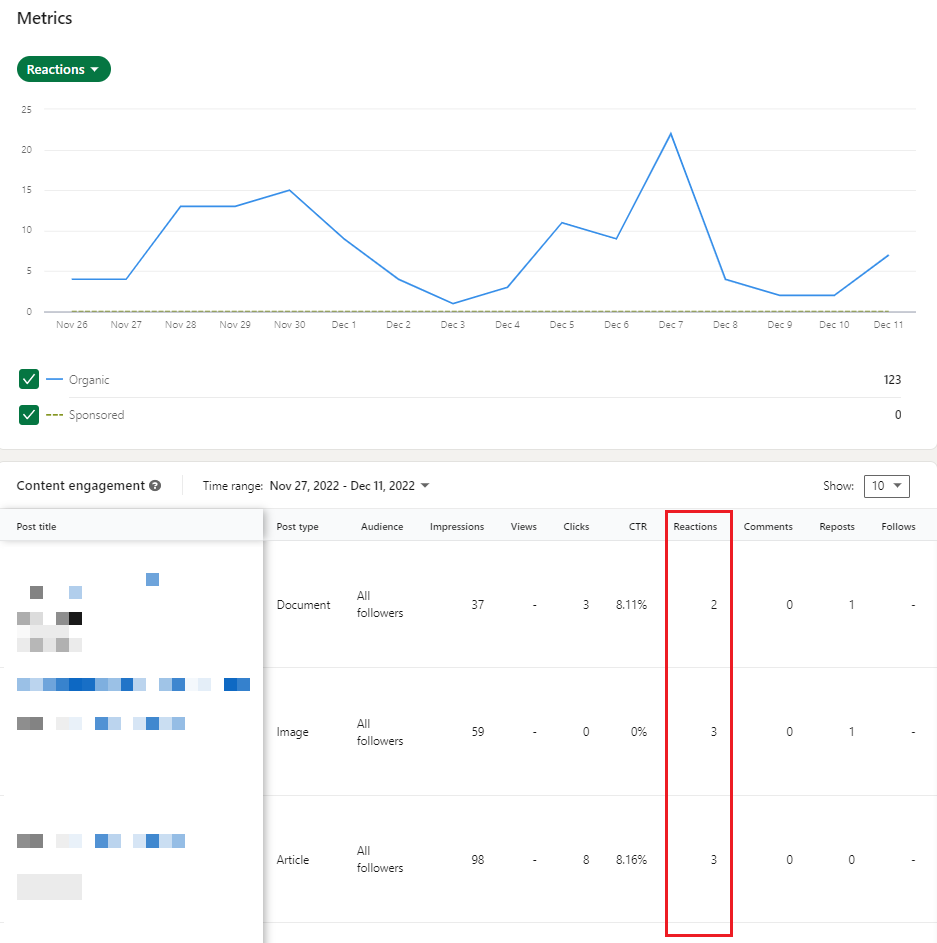
The same can be done for Instagram, although regular posts on Feed can only receive likes on this platform, and reactions are reserved solely for Instagram Stories and Instagram Live.
Alternatively, you can use other platforms to track this metric. Semrush allows you to see the percentage for each content reaction on a given platform:

When to track likes & reactions?
This KPI directly shows how engaging your posts are to your followers. It allows you to get to know your target audience better and optimize your social media content to serve their needs and expectations.
KPI #6: Comments
Comments are replies social media users leave under your posts.
A comment can be both positive and negative, ask a question, express an opinion, etc. Either way, such follower feedback creates an online conversation that boosts content engagement.
Social media comments can also contain different elements, such as hashtags, mentions, and emojis. Each reply can also receive reactions similar to those people leave under your posts.
Here’s how you track comments per post.
On Facebook, apart from looking under each published piece of content, you can only see comments with reactions and shares counted together.
In its turn, LinkedIn shows when your posts received the most comments and how many replies each post has:
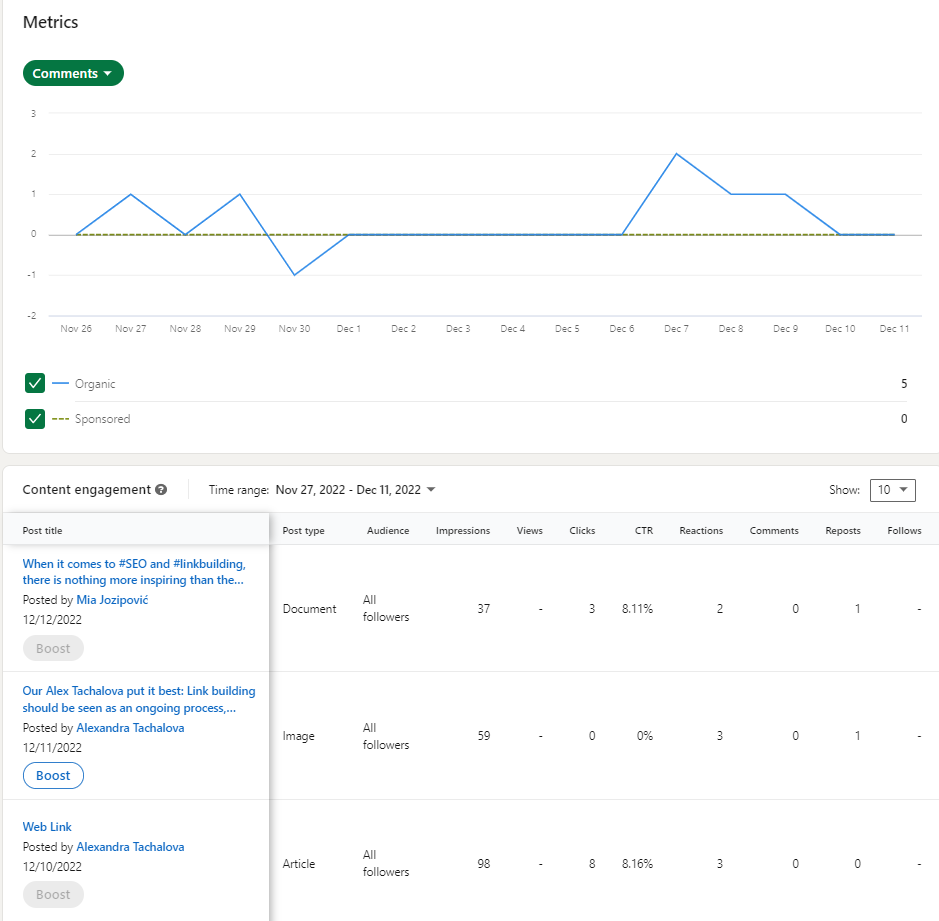
When it comes to Instagram, you can view the number of comments in Post Insights. On Twitter, this metric is called Replies, and you can review it in Tweet Activity.
When to track social media comments?
First and foremost, comments show how engaged your followers are. But it’s not the only use for this KPI.
Regularly reading replies helps in risk management and prevents negative publicity. Besides, replying to both positive and negative comments (in a polite way, of course) shows your followers that their opinion matters, which, in turn, boosts their trust in you.
KPI #7: Shares
Social shares (retweets on Twitter and repins on Pinterest) show how many times people reposted your content to their channels.
If you want to track this engagement KPI for your posts on Facebook, you will have to use a tool alternative to Insights since the platform combines shares with other metrics. For instance, Hootsuite and its alternatives provide detailed data on shares.
As for LinkedIn, you can review the number of reposts within a given time frame, plus the number of shares per post:
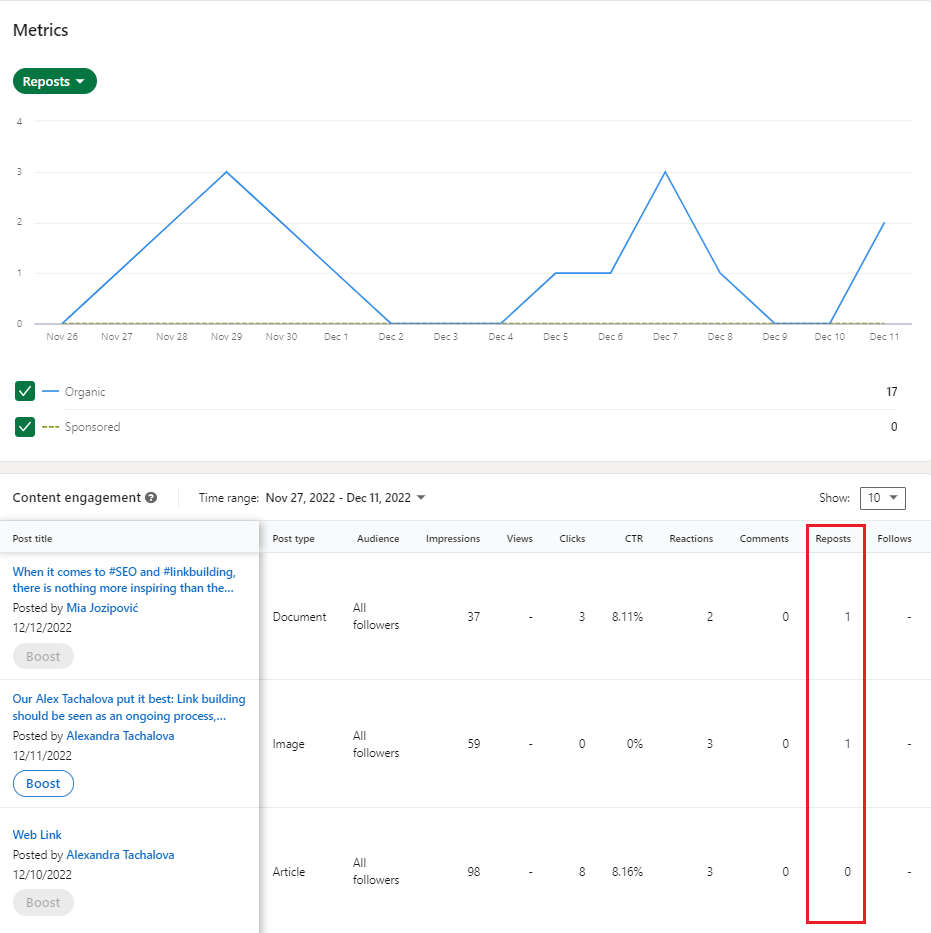
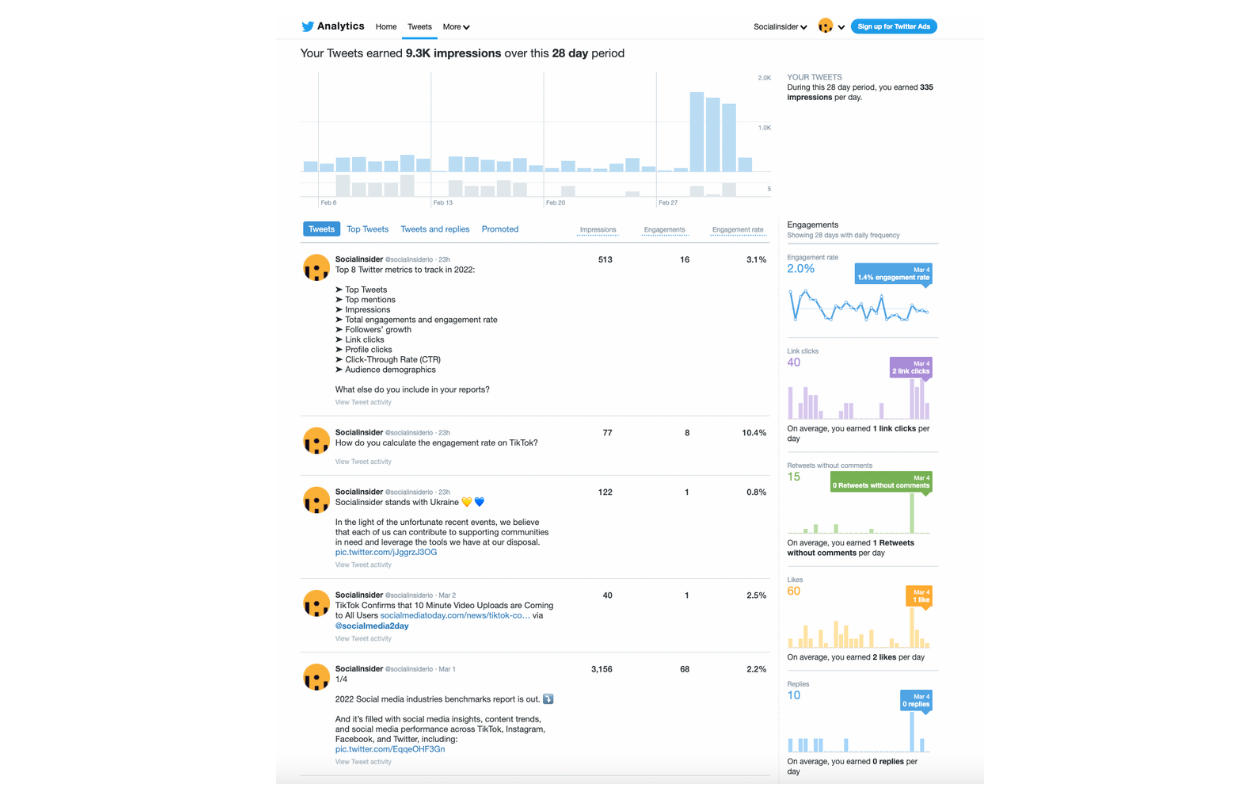
Twitter is even more specific about this metric – you can see the number of retweets with and without comments for every post:
The overview of shares on Instagram is only available if you have a Business account. All you need to do is click on View Insights under the post, and you’ll see the number of likes, comments, saves, and shares.
When to track reposts?
The growing number of shares reflects the high engagement of your content. So, it’s another metric showing how well your posts agree with your target audience’s interests.
KPI #8: Engagement Rate
The engagement rate reflects the percentage of interactions your social media content receives.
Here’s how to calculate it:
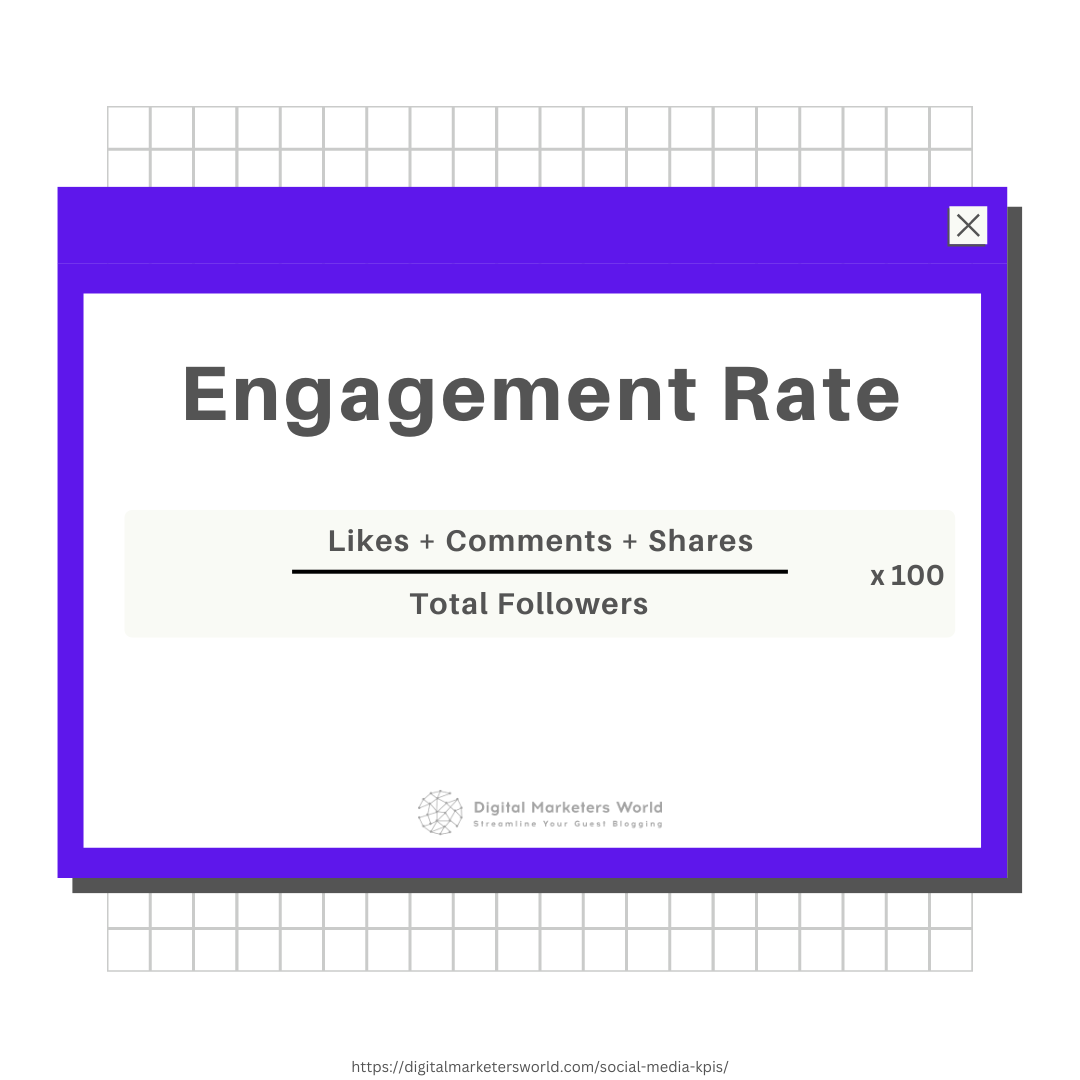
Engagement rate is the KPI you can easily find on all social media platforms, although they all show this data a bit differently.
Facebook presents all engagement metrics together (clicks plus shares, likes, and comments), so if you want to see this metric for every post, you’ll need a separate tool. For example, here’s how the engagement rate appears in Semrush:
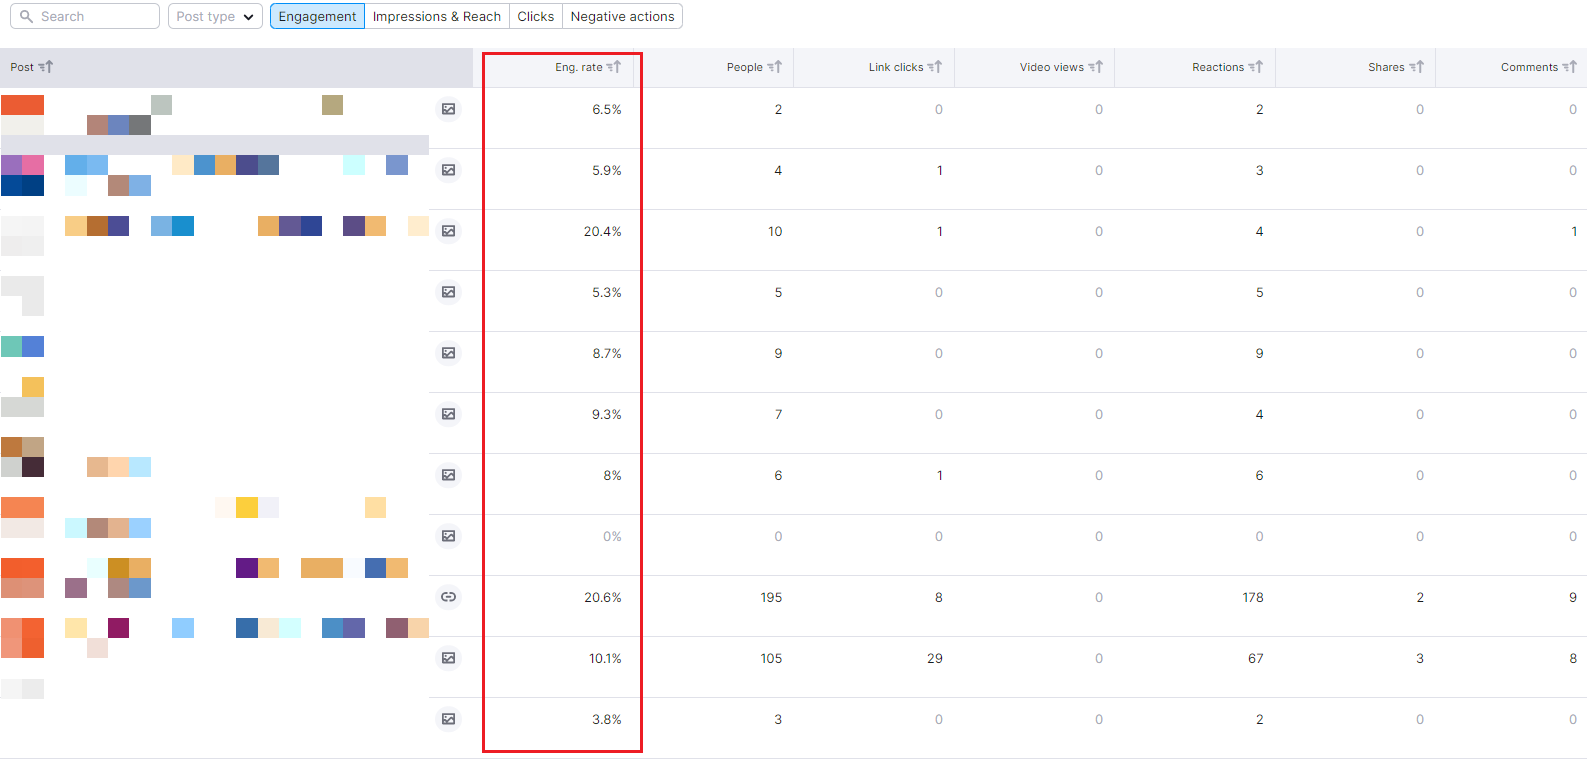
You can also review the average engagement rate your content has received within a pre-set timeframe.
When it comes to LinkedIn, you can review this KPI along with other engagement metrics in the Content tab:
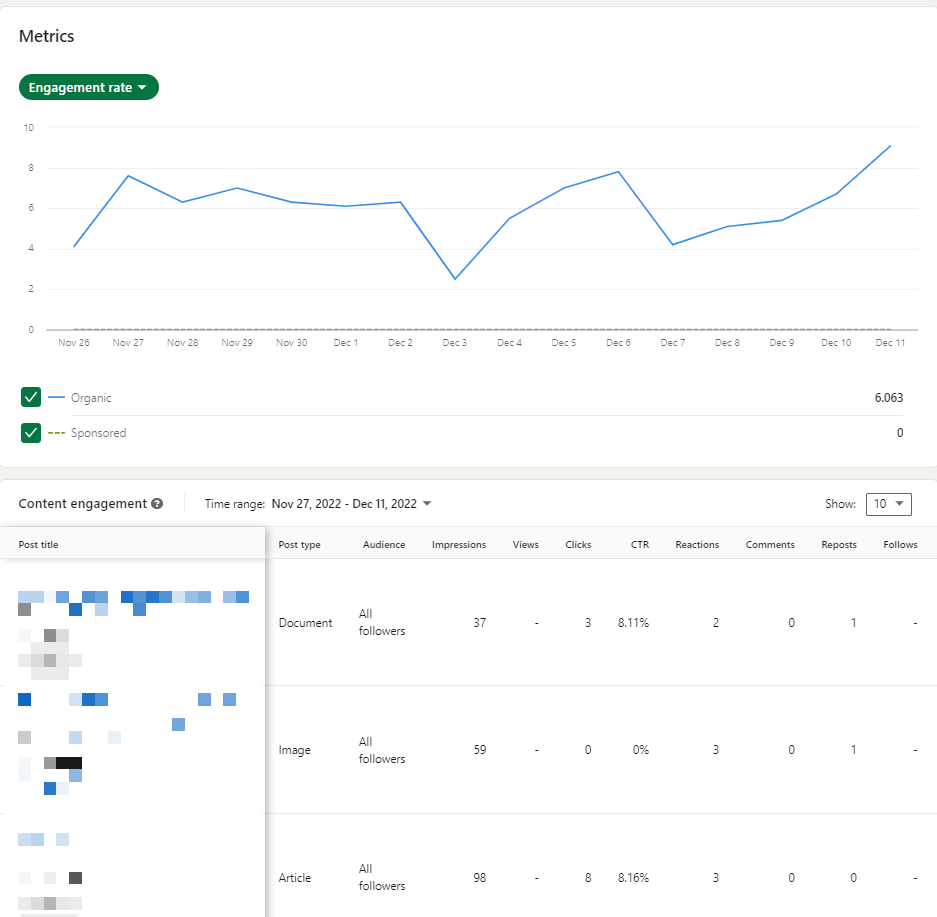
You can also view the engagement rate per post on LinkedIn by visiting your Activity page.
Finally, the engagement rate for tweets is available via Tweet Activity in Analytics, and as for Instagram graphics and Stories, this information is easily accessible via the Insights tab.
When to track engagement rate?
This is one of the most important metrics indicating overall success of your social media marketing strategy.
If the percentage is low, you should start seeking solutions to change the direction of your content, the time you publish your posts (by the way, we have articles on this topic for Twitter and TikTok), implement ways of interacting with your followers more actively, etc.
KPI #9: Conversion Rate
The social media conversion rate is the percentage of completed actions by post. This metric is also used in email campaign management.
You can calculate the conversion rate with this formula:
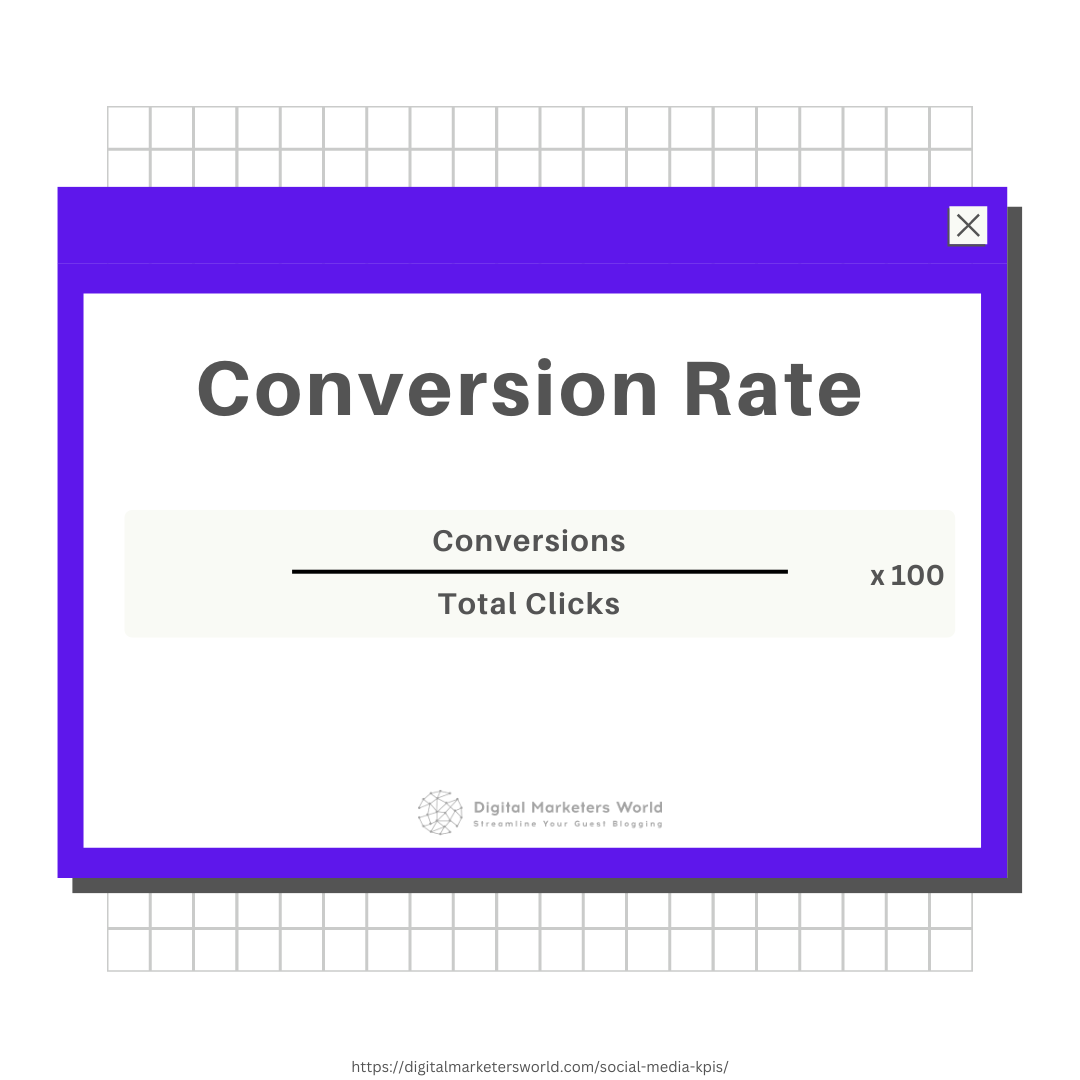
Conversion rate is not always about a sale (although this can also be the goal of a social media post). You can count it as a conversion if a person clicks on the button and subscribes to your newsletter, follows your account, or even shares their email.
The most popular social media channels only allow you to see conversions for the ads you run on these platforms. For each campaign, you will see the type of conversion (a subscription, purchase, etc.) and the number of completed actions.
Here we have an example of conversion in the form of landing page views for a Facebook ad (you can view this info via Facebook Ad Manager):
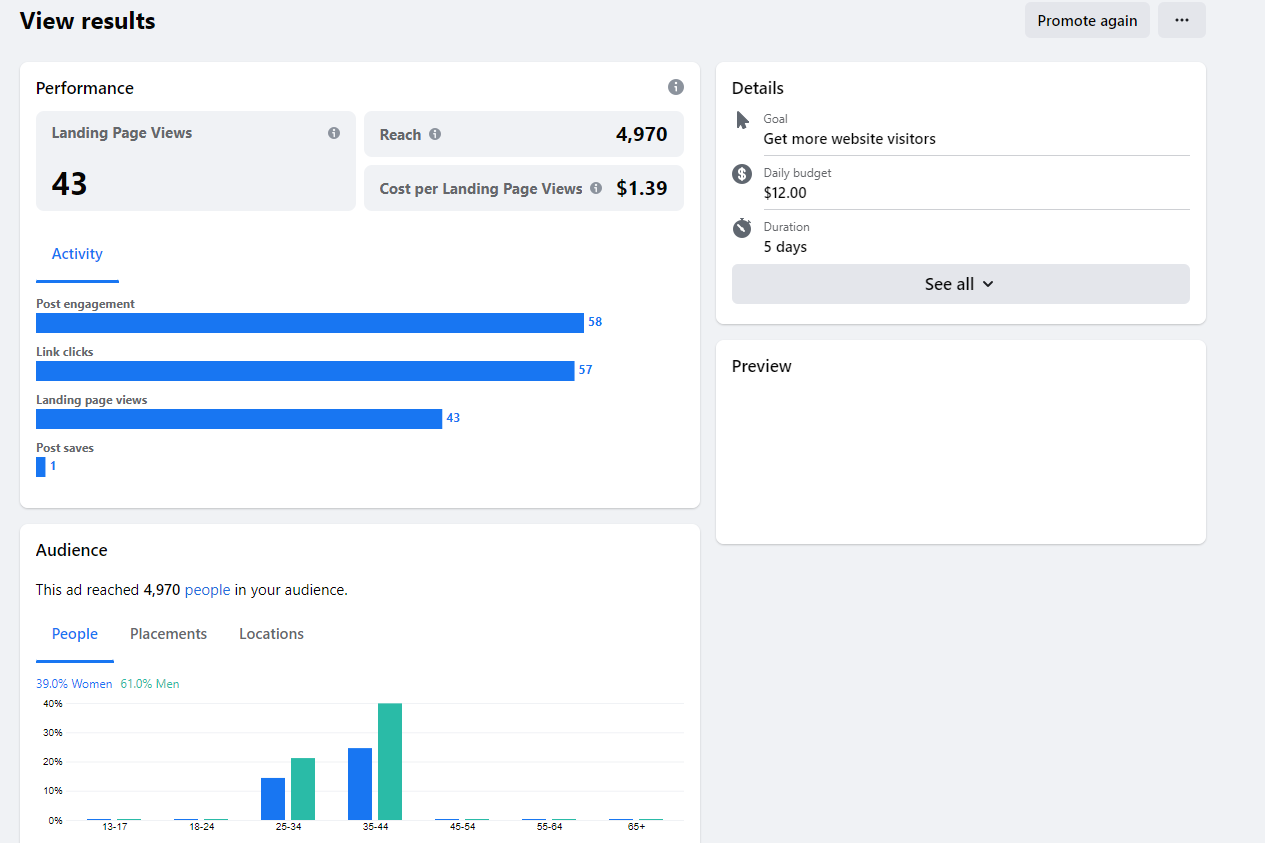
Next, all you’ll have to do is use this number of conversions to calculate the rate using the formula we provided.
When to track your conversion rate?
Being one of the important social media KPIs, conversion rate helps you understand your audience. A high conversion rate shows that your followers are interested in what you’re offering.
Apart from that, monitoring this KPI helps improve the overall content experience on your profile and produce more similar content that drives social media reach and impressions.
Finally, this metric helps you understand your return on investment and how much your social media efforts cost you. Without conversion tracking, it’s hard to measure whether your social media marketing campaigns bring positive results.
KPI #10: Mentions
Social media mentions are posts or comments that tag your brand.
You can track @mentions on Facebook via a supplementary tool because the platform only shows them in the Notifications menu without any categorization. The same goes for LinkedIn.
Twitter offers more structured data for this metric – you can review all profile mentions and their growth trend in the Analytics tab:
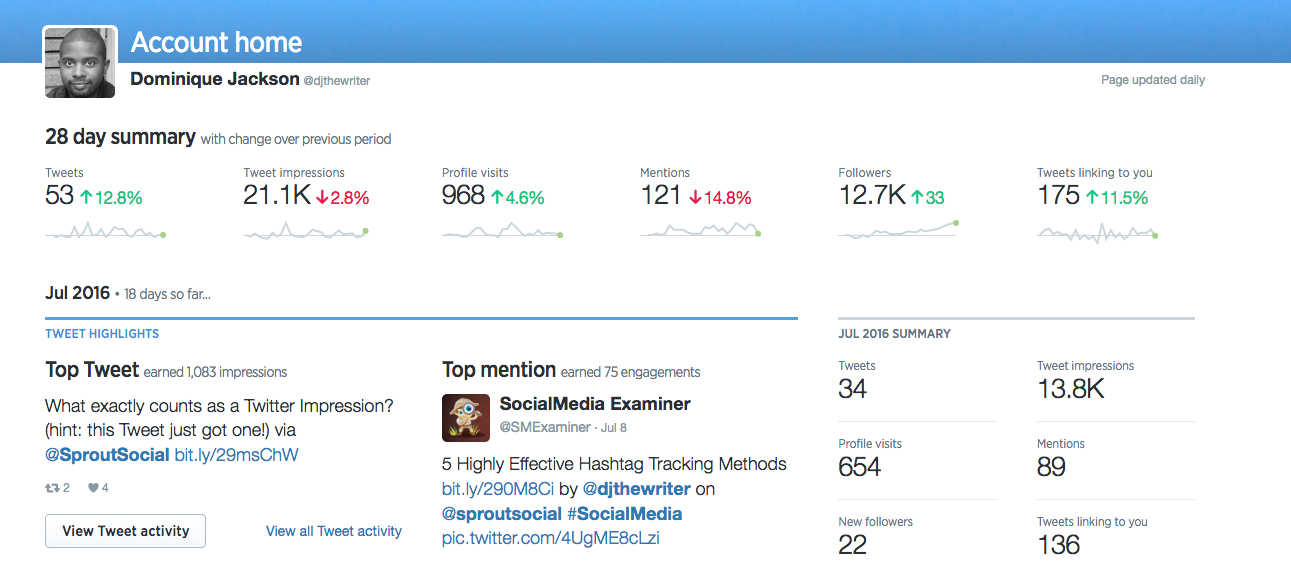
Instagram also shares this data – you can find it under the Activity tab, which lists likes, mentions, and tags.
When to track social media mentions?
Mentions directly reflect the demand for your content and what it offers.
Positive brand mentions reflect the overall trust in your brand, while negative tags help you detect problems connected with your business early on and address them in a timely manner.
You can also track brand tags to see how people react to something (e.g., if you announced in your latest post that you’re launching a new product). A growing number of positive mentions implies that your target audience is excited about the upcoming changes.
KPI #11: Share of Voice
Share of voice (SOV) is a KPO that compares your brand’s visibility (in this case, on social media) to your competitors. This metric is also used in paid advertising.
How do you calculate this KPI?
You can use this formula template:
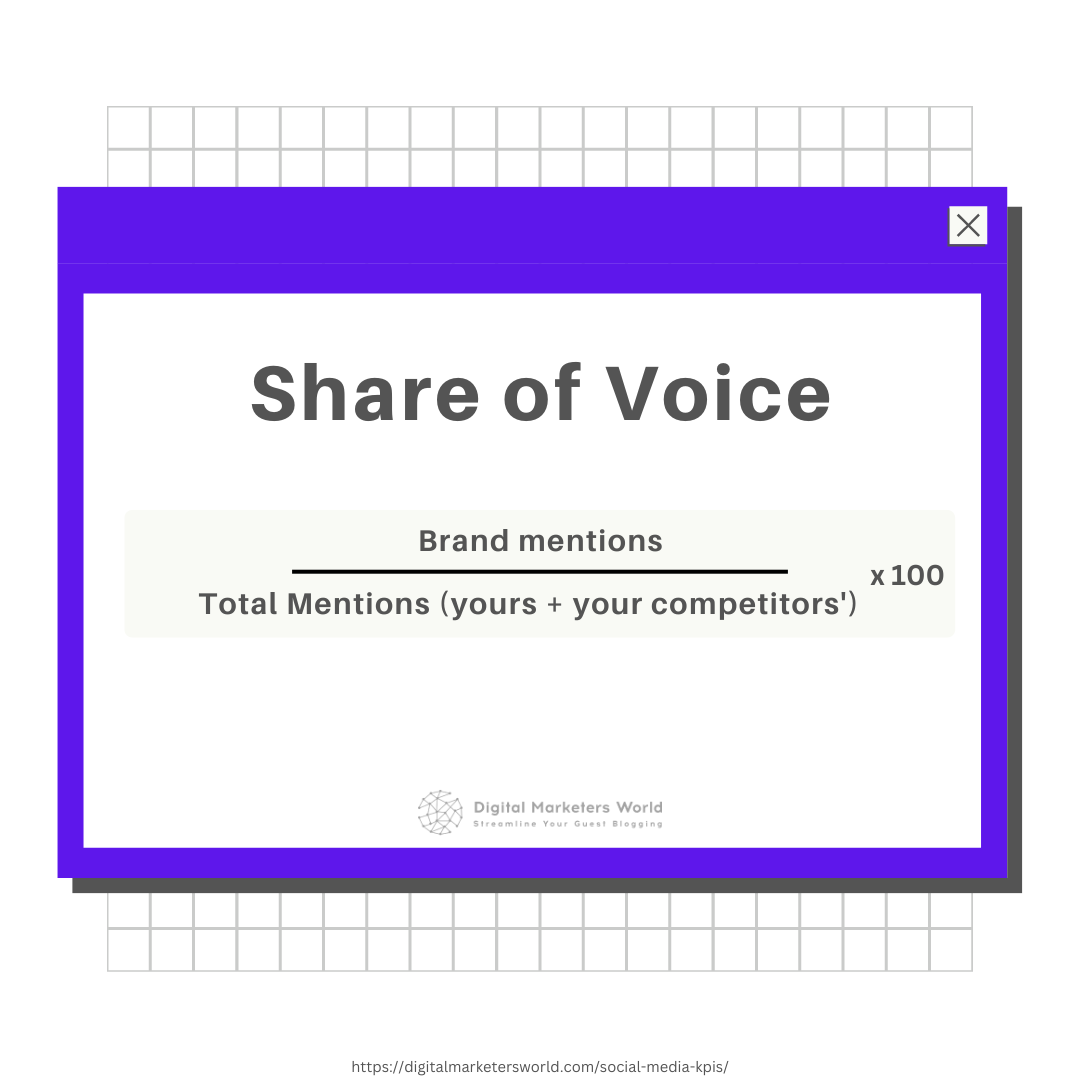
Tracking this metric is not possible via built-in analytics tools on social media (although you can still calculate it manually), so you will need a good social listening tool to get the data on your and your competitors’ brand mentions.
For instance, you can get your hands on Hootsuite, Buffer, Buzzsumo, Sprout Social, or Agorapulse – all of them have the social listening feature.
By the way, we have comparison articles on Buffer, Sprout Social, and Later vs. Hootsuite if you want to learn more about their functionalities.
When to track share of voice?
Social media marketers usually apply this KPI to track progress in sales and brand awareness.
Apart from that, this metric also gives you a more profound understanding of the market. For instance, you can learn more about public sentiment and how people view your brand vs. your competitors.
KPI #12: CPC (Cost per Click)
Cost per click is a metric that measures how much each click on an ad will cost in a social media advertising campaign.
Here is the formula for this KPI:
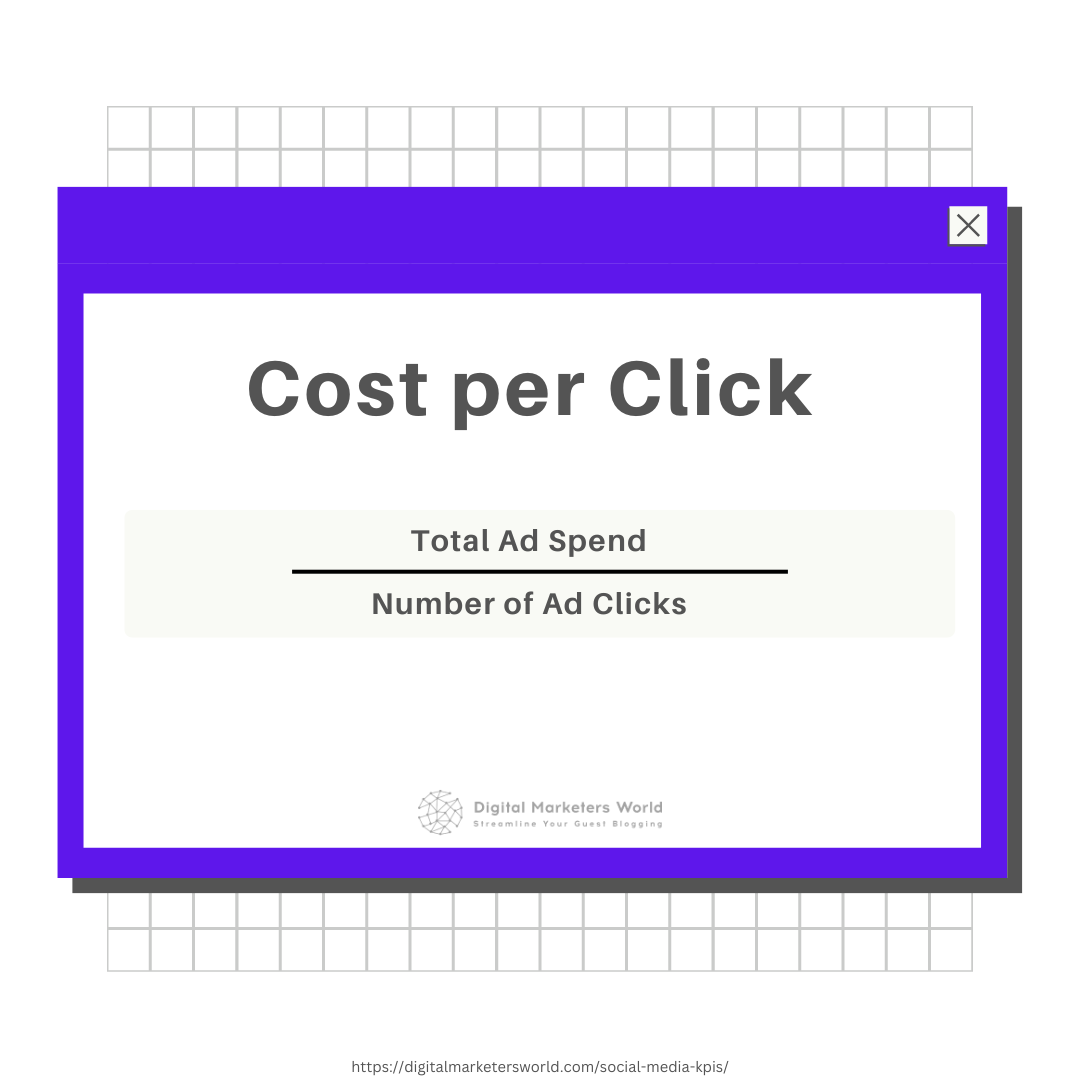
How much does a click cost in social media advertising?
A lot depends on the social channel where you’ll advertise. Just to give you an example, according to WebFX benchmarks, the CPC for Instagram ads can be about $3.56, while Facebook charges around $0.97 per click on average. Twitter is one of the most affordable platforms for social advertising, with an average of $0.38 CPC.
If you need to track CPC, you can either use one of the above-mentioned platforms (make sure the tool supports social media ad campaigns) or take advantage of Google Analytics (the browser addon has the monthly volume, CPC, and competition tables you can monitor).
When to track CPC?
This metric is related to advertising, so tracking it is essential if you want to make sure your advertising campaigns have good ROI.
KPI #13: CPL (Cost per Lead)
Cost per lead reflects how much of your lead generation budget goes to acquiring new prospects.
Here’s the formula for it:
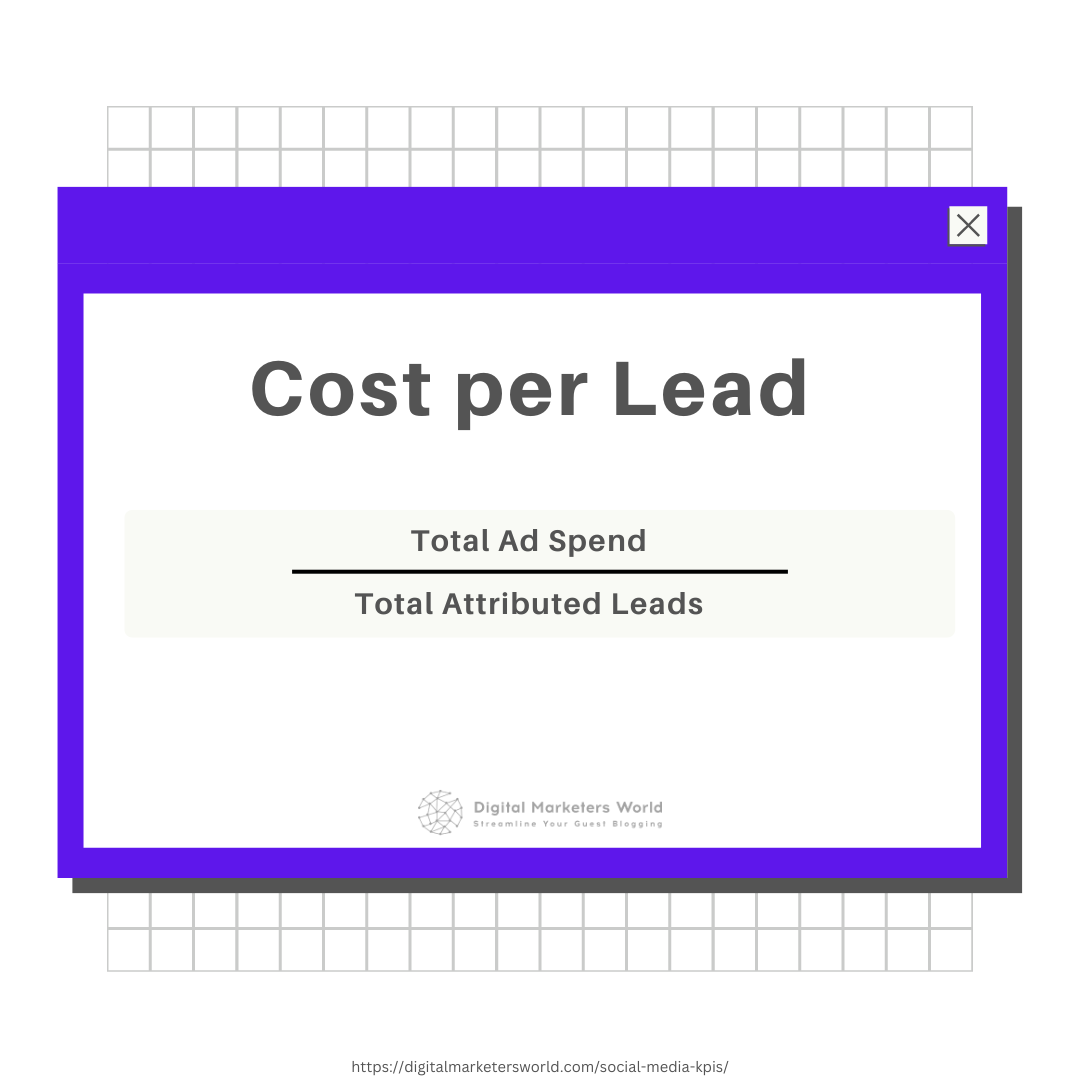
Your average CPL will depend on the industry you’re in. For example, LinchpinSEO says that IT and Technical services have the highest median cost per lead – $208, while non-profits enjoy the lowest CPC – $31.
To track your cost per lead, you’ll need two other metrics – the dollar amount spent on the acquisition of a new lead and the total number of prospects you’ve acquired.
When to track cost per lead?
The bottom line is that this metric is essential to help you understand the effectiveness of your lead generation efforts. It indicates which strategies work and which don’t, helping you reduce costs on attracting new customers.
Now Over to You
And that’s a wrap.
These social media metrics may sound overwhelming, but you can have a tool that would report on them to you automatically. To reach KPIs, all you need to do is make the right conclusions and implement proper changes.
This guide is one of many we have on social media and other topics. Make sure to check out our blog, where we cover all things digital marketing to help you build your online presence from scratch.

Mariia is a content strategist and editor at Digital Marketer’s World. She is passionate about educating others on all things marketing and believes in the power of the written word.
